There are two main metrics that are the focus of OAM-PM: delay and loss. The different metrics have two unique storage structures and will allocate their own measurement intervals for these structures. This occurs regardless of whether the performance data is gathered with a single packet or multiple packet types.
Delay metrics include Frame Delay (FD), InterFrame Delay Variation (IFDV), Frame Delay Range (FDR) and Mean Frame Delay (MFD). Unidirectional and round trip results are stored for each metric:
Frame Delay
The Frame Delay is the amount of time required to send and receive the packet.
InterFrame Delay Variation
IFDV is the difference in the delay metrics between two adjacent packets.
Frame Delay Range
The Frame Delay Range is the difference between the minimum frame delay and the individual packet
Mean Frame Delay
The Mean Frame Delay is the mathematical average for the frame delay over the entire window.
FD, IFDV and FDR statistics are binnable results. FD, IFDV, FDR and MFD all include minimum, maximum, and average values. Unidirectional and round trip results are stored for each metric.
Unidirectional frame delay and frame delay range measurements require exceptional time of day clock synchronization. If the time of day clock does not exhibit extremely tight synchronization, unidirectional measurements will not be representative. In one direction, the measurement will be artificially increased by the difference in the clocks. In the other direction, the measurement will be artificially decreased by the difference in the clocks. This level of clocking accuracy is not available with NTP. To achieve this level of time of day clock synchronization, Precision Time Protocol (PTP) 1588v2 should be considered.
Round trip metrics do not require clock synchronization between peers, since the four timestamps allow for accurate representation of the round trip delay. The mathematical computation removes remote processing and any difference in time of day clocking. Round trip measurements do require stable local time of day clocks.
Any delay metric that is negative will be treated as zero and placed in bin 0, the lowest bin which has a lower boundary of 0 microseconds.
Delay results are mapped to the measurement interval that is active when the result arrives back at the source.
There are no supported log events based on delay metrics.
Loss metrics are only unidirectional and will report frame loss ratio (FLR) and availability information. Frame loss ratio is the computation of loss (lost/sent) over time. Loss measurements during periods of unavailability are not included in the FLR calculation as they are counted against the unavailability metric.
Availability requires relating three different functions. First, the individual probes are marked as available or unavailable based on sequence numbers in the protocol. A number of probes are rolled up into a small measurement window, typically 1 s. Frame loss ratio is computed over all the probes in a small window. If the resulting percentage is higher than the configured threshold, the small window is marked as unavailable. If the resulting percentage is lower than the threshold, the small window is marked as available. A sliding window is defined as some number of small windows, typically 10. The sliding window is used to determine availability and unavailability events. Switching from one state to the other requires every small window in the sliding window to be the same state and different from the current state.
Availability and unavailability counters are incremented based on the number of small windows that have occurred in all available and unavailable windows.
Availability and unavailability using synthetic loss measurements is meant to capture the loss behavior for the service. It is not meant to capture and report on service outages or communication failures. Communication failures of a bidirectional or unidirectional nature must be captured using some other means of connectivity verification, alarming, or continuity checking. During times of complete or extended failure periods it becomes necessary to timeout individual test probes. It is not possible to determine the direction of the loss because no response packets are being received back on the source. In this case, the statistics calculation engine maintains the previous state, updating the appropriate directional availability or unavailability counter. At the same time, an additional per-direction undetermined counter is updated. This undetermined counter is used to indicate that the availability or unavailability statistics could not be determined for a number of small windows.
During connectivity outages, the higher level systems can be used to discount the loss measurement interval, which covers the same span as the outage.
Availability and unavailability computations may delay the completion of a measurement interval. The declaration of a state change or the delay to a closing a measurement interval could be equal to the length of the sliding window and the timeout of the last packet. Closing of a measurement interval cannot occur until the sliding window has determined availability or unavailability. If the availability state is changing and the determination is crossing two measurement intervals, the measurement interval will not complete until the declaration has occurred. Typically, standard bodies indicate the timeout per packet. In the case of Ethernet, DMMv1, and SLM, timeout values are set at 5 s and cannot be configured.
There are no log events based on availability or unavailability state changes.
During times of availability, there can be times of high loss intervals (HLI) or consecutive high loss intervals (CHLI). These are indicators that the service was available but individual small windows or consecutive small windows experienced frame loss ratios exceeding the configured acceptable limit. A HLI is any single small window that exceeds the configured frame loss ratio. This could equate to a severely errored second, assuming the small window is one second. A CHIL is a consecutive high loss interval that exceeds a consecutive threshold within the sliding window. Only one HLI will be counted for a window.
Availability can only be reasonably determined with synthetic packets. This is because the synthetic packet is the packet being counted and provides a uniform packet flow that can be used for the computation. Transmit and receive counter-based approaches cannot reliably be used to determine availability because there is no guarantee that service data is on the wire, or the service data on the wire uniformity could make it difficult to make a declaration valid.
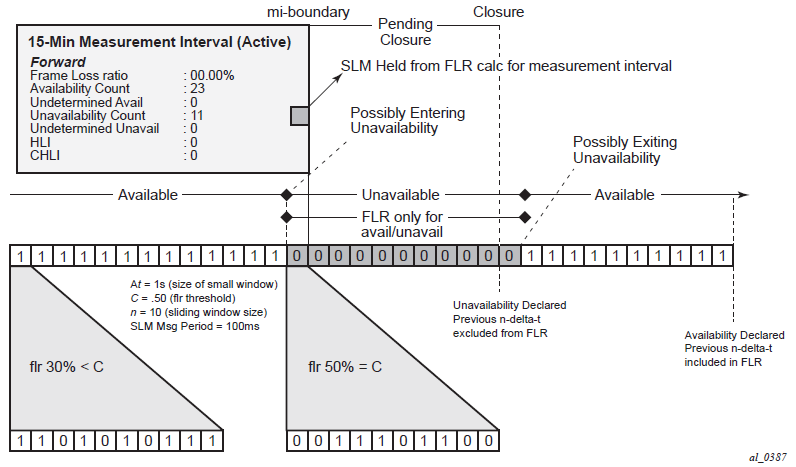
The following figure shows loss in a single direction using synthetic packets, and demonstrates what happens when a possible unavailability event crosses a measurement interval boundary. In the diagram, the first 13 small windows are all marked available (1), which means that the loss probes that fit into each of those small windows did not equal or exceed a frame loss ratio of 50%. The next 11 small windows are marked as unavailable, which means that the loss probes that fit into each of those small windows were equal to or above a frame loss ratio of 50%. After the 10th consecutive small window of unavailability, the state transitions from available to unavailable. The 25th small window is the start of the new available state which is declared following the 10th consecutive available small window. Notice that the frame loss ratio is 00.00%; this is because all the small windows that are marked as unavailable are counted toward unavailability, and therefore are excluded from impacting the FLR. If there were any small windows of unavailability that were outside of an unavailability event, they would be marked as HLI or CHLI and be counted as part of the frame loss ratio.