OAM, SAA, and OAM-PM
In This Chapter
This chapter provides information about the Operations, Administration and Management (OAM) and Service Assurance Agent (SAA) commands available in the CLI for troubleshooting services.
Topics in this chapter include:
OAM Overview
Delivery of services requires a number of operations occur properly and at different levels in the service delivery model. For example, operations such as the association of packets to a service, VC-labels to a service and each service to a service tunnel must be performed properly in the forwarding plane for the service to function properly. In order to verify that a service is operational, a set of in-band, packet-based Operation, Administration, and Maintenance (OAM) tools is required, with the ability to test each of the individual packet operations.
For in-band testing, the OAM packets closely resemble customer packets to effectively test the customer's forwarding path, but they are distinguishable from customer packets so they are kept within the service provider's network and not forwarded to the customer.
The suite of OAM diagnostics supplement the basic IP ping and traceroute operations with diagnostics specialized for the different levels in the service delivery model. There are diagnostics for MPLS LSPs, SDPs, services and VPLS MACs within a service.
This section describes the following topics:
LSP Diagnostics: LSP Ping and Trace
The router LSP diagnostics are implementations of LSP ping and LSP trace based on RFC 4379, Detecting Multi-Protocol Label Switched (MPLS) Data Plane Failures. LSP ping provides a mechanism to detect data plane failures in MPLS LSPs. LSP ping and LSP trace are modeled after the ICMP echo request/reply used by ping and trace to detect and localize faults in IP networks.
For a given LDP FEC, RSVP P2P LSP, or BGP IPv4 Label Router, LSP ping verifies whether the packet reaches the egress label edge router (LER), while in LSP trace mode, the packet is sent to the control plane of each transit label switched router (LSR) which performs various checks to see if it is actually a transit LSR for the path.
The downstream mapping TLV is used in lsp-ping and lsp-trace to provide a mechanism for the sender and responder nodes to exchange and validate interface and label stack information for each downstream of an LDP FEC or an RSVP LSP and at each hop in the path of the LDP FEC or RSVP LSP.
Two downstream mapping TLVs are supported. The original Downstream Mapping (DSMAP) TLV defined in RFC 4379 and the new Downstream Detailed Mapping (DDMAP) TLV defined in RFC 6424.
When the responder node has multiple equal cost next-hops for an LDP FEC prefix, the downstream mapping TLV can further be used to exercise a specific path of the ECMP set using the path-destination option. The behavior in this case is described in the ECMP sub-section below.
LSP Ping/Trace for an LSP Using a BGP IPv4 Label Route
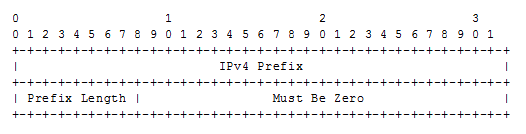
This feature adds support of the target FEC stack TLV of type BGP Labeled IPv4 /32 Prefix as defined in RFC 4379.
The new TLV is structured as shown in Figure 21.
Figure 21: Target FEC Stack TLV for a BGP Labeled IPv4 Prefix
The user issues a LSP ping using the existing CLI command and specifying a new type of prefix:
oam lsp-ping bgp-label prefix ip-prefix/mask [src-ip-address ip-address] [fc fc-name [profile {in|out}]] [size octets] [ttl label-ttl] [send-count send-count] [timeout timeout] [interval interval] [path-destination ip-address [interface if-name | next-hop ip-address]] [detail]
The path-destination option is used for exercising specific ECMP paths in the network when the LSR performs hashing on the MPLS packet.
Similarly, the user issues a LSP trace using the following command:
oam lsp-trace bgp-label prefix ip-prefix/mask [src-ip-address ip-address] [fc fc-name [profile {in|out}]] [max-fail no-response-count] [probe-count probes-per-hop] [size octets] [min-ttl min-label-ttl] [max-ttl max-label-ttl] [timeout timeout] [interval interval] [path-destination ip-address [interface if-name | next-hop ip-address]] [detail]
The following are the procedures for sending and responding to an LSP ping or LSP trace packet. These procedures are valid when the downstream mapping is set to the DSMAP TLV. The detailed procedures with the DDMAP TLV are presented in Using DDMAP TLV in LSP Stitching and LSP Hierarchy.
- The next-hop of a BGP label route for a core IPv4 /32 prefix is always resolved to an LDP FEC or an RSVP LSP. Thus the sender node encapsulates the packet of the echo request message with a label stack which consists of the LDP/RSVP outer label and the BGP inner label.If the packet expires on an RSVP or LDP LSR node which does not have context for the BGP label IPv4 /32 prefix, it validates the outer label in the stack and if the validation is successful it replies the same way as it does today when it receives an echo request message for an LDP FEC which is stitched to a BGP IPv4 label route. In other words it replies with return code 8 Label switched at stack-depth <RSC>.
- An LSR node which is the next-hop for the BGP label IPv4 /32 prefix as well as the LER node which originated the BGP label IPv4 prefix have full context for the BGP IPv4 target FEC stack and can thus perform full validation of it.
- If the BGP IPv4 label route is stitched to an LDP FEC, the egress LER for the resulting LDP FEC will not have context for the BGP IPv4 target FEC stack in the echo request message and replies with return code 4 Replying router has no mapping for the FEC at stack- depth <RSC>. This is the same behavior as that of an LDP FEC which is stitched to a BGP IPv4 label route when the echo request message reaches the egress LER for the BGP prefix.
Note that only BGP label IPv4 /32 prefixes are supported since these are usable as tunnels on the Alcatel-Lucent router platform. BGP label IPv6 /128 prefixes are not currently usable as tunnels on the Alcatel-Lucent router platform and as such are not supported in LSP ping/trace.
ECMP Considerations
When the responder node has multiple equal cost next-hops for an LDP FEC or a BGP label IPv4 prefix, it replies in the Downstream Mapping TLV with the downstream information of the outgoing interface which is part of the ECMP next-hop set for the prefix.
Note that when BGP label route is resolved to an LDP FEC (of the BGP next-hop of the BGP label route), ECMP can exist at both the BGP and LDP levels. The following selection of next-hop is performed in this case:
- For each BGP ECMP next-hop of the label route, a single LDP next-hop is selected even if multiple LDP ECMP next-hops exist. Thus, the number of ECMP next-hops for the BGP IPv4 label route will be equal to the number of BGP next-hops.
- ECMP for a BGP IPv4 label route is only supported at PE router (BGP label push operation) and not at ABR/ASBR (BGP label swap operation). Thus at an LSR, a BGP IPv4 label route will be resolved to a single BGP next-hop which itself is resolved to a single LDP next-hop.
- LSP trace will return one downstream mapping TLV for each next-hop of the BGP IPv4 label route. Furthermore, it will return exactly the LDP next-hop the data path programmed for each BGP next-hop.
The following description of the behavior of LSP ping and LSP trace makes a reference to a FEC in a generic way and which can represent an LDP FEC or a BGP IPv4 label route. In addition the reference to a downstream mapping TLV means either the DSMAP TLV or the DDMAP TLV.
- If the users initiates an lsp-trace of the FEC without the path-destination option specified, then the sender node will not include multi-path information in the Downstream Mapping TLV in the echo request message (multipath type=0). In this case, the responder node will reply with a Downstream Mapping TLV for each outgoing interface which is part of the ECMP next-hop set for the FEC. Note that the sender node will select the first Downstream Mapping TLV only for the subsequent echo request message with incrementing TTL.
- If the user initiates an lsp-ping of the FEC with the path-destination option specified, then the sender node will not include the Downstream Mapping TLV. However, the user can use the interface option, part of the same path-destination option, to direct the echo request message at the sender node to be sent out a specific outgoing interface which is part of an ECMP path set for the FEC.
- If the user initiates an lsp-trace of the FEC with the path-destination option specified but configured not to include a downstream mapping TLV in the MPLS echo request message using the CLI command downstream-map-tlv {none}, then the sender node will not include the Downstream Mapping TLV. However, the user can use the interface option, part of the same path-destination option, to direct the echo request message at the sender node to be sent out a specific outgoing interface which is part of an ECMP path set for the FEC.
- If the user initiates an lsp-trace of the FEC with the path-destination option specified, then the sender node will include the multipath information in the Downstream Mapping TLV in the echo request message (multipath type=8). The path-destination option allows the user to exercise a specific path of a FEC in the presence of ECMP. This is performed by having the user enter a specific address from the 127/8 range which is then inserted in the multipath type 8 information field of the Downstream Mapping TLV. The CPM code at each LSR in the path of the target FEC runs the same hash routine as the data path and replies in the Downstream Mapping TLV with the specific outgoing interface the packet would have been forwarded to if it did not expire at this node and if DEST IP field in the packet’s header was set to the 127/8 address value inserted in the multipath type 8 information.This hash is based on:
- The {incoming port, system interface address, label-stack} when the lsr-load-balancing option of the incoming interface is configured to lbl-only. In this case the 127/8 prefix address entered in the path-destination option is not used to select the outgoing interface. All packets received with the same label stack will map to a single and same outgoing interface.
- The {incoming port, system interface address, label-stack, SRC/DEST IP fields of the packet} when the lsr-load-balancing option of the incoming interface is configured to lbl-ip. The SRC IP field corresponds to the value entered by the user in the src-ip-address option (default system IP interface address). The DEST IP field corresponds to the 127/8 prefix address entered in the path-destination option. In this case, the CPM code will map the packet, as well as any packet in a sub-range of the entire 127/8 range, to one of the possible outgoing interface of the FEC.
- The {SRC/DEST IP fields of the packet} when the lsr-load-balancing option of the incoming interface is configured to ip-only. The SRC IP field corresponds to the value entered by the user in the src-ip-address option (default system IP interface address). The DEST IP field corresponds to the 127/8 prefix address entered in the path-destination option. In this case, the CPM code will map the packet, as well as any packet in a sub-range of the entire 127/8 range, to one of the possible outgoing interface of the FEC.
In all above cases, the user can use the interface option, part of the same path-destination option, to direct the echo request message at the sender node to be sent out a specific outgoing interface which is part of an ECMP path set for the FEC.Note that if the user enabled the system-ip-load-balancing hash option (config>system>system-ip-load-balancing), then the LSR hashing is modified by applying the system IP interface, with differing bit-manipulation, to the hash of packets of all three options (lbl-only, lbl-ip, ip-only). This system level option enhances the LSR packet distribution such that the probability of the same flow selecting the same ECMP interface index or LAG link index at two consecutive LSR nodes is minimized. - The ldp-treetrace tool always uses the multipath type=8 and inserts a range of 127/8 addresses instead of a single address in order multiple ECMP paths of an LDP FEC. As such, it behaves the same way as the lsp-trace with the path-destination option enabled described above.
- Note that the path-destination option can also be used to exercise a specific ECMP path of an LDP FEC, which is tunneled over a RSVP LSP or of an LDP FEC stitched to a BGP FEC in the presence of BGP ECMP paths. The user must however enable the use of the new DDMAP TLV either globally (config>test-oam>mpls-echo-request-downstream-map ddmap) or within the specific ldp-treetrace or lsp-trace test (downstream-map-tlv ddmap option).
lsp-ping and lsp-trace over Unnumbered IP Interface
Lsp-ping and p2mp-lsp-ping operate over a network using unnumbered links without any changes. Lsp-trace, p2mp-lsp-trace and ldp-treetrace are modified such that the unnumbered interface is properly encoded in the downstream mapping (DSMAP/DDMAP) TLV.
In a RSVP P2P or P2MP LSP, the upstream LSR encodes the downstream router-id in the “Downstream IP Address” field and the local unnumbered interface index value in the “Downstream Interface Address” field of the DSMAP/DDMAP TLV as per RFC 4379. Both values are taken from the TE database.
In a LDP unicast FEC or mLDP P2MP FEC, the interface index assigned by the peer LSR is not readily available to the LDP control plane. In this case, the alternative method described in RFC 4379 is used. The upstream LSR sets the Address Type to IPv4 Unnumbered, the Downstream IP Address to a value of 127.0.0.1, and the interface index is set to 0. If an LSR receives an echo-request packet with this encoding in the DSMAP/DDMAP TLV, it will bypass interface verification but continue with label validation.
Downstream Detailed Mapping (DDMAP) TLV
The DDMAP TLV provides the same features as the existing DSMAP TLV, plus the enhancement to trace the details of LSP stitching and LSP hierarchy. The latter is achieved using a new sub-TLV of the DDMAP TLV called the FEC stack change sub-TLV. Figure 22 shows the structures of these two objects as defined in RFC 6424.
Figure 22: DDMAP TLV
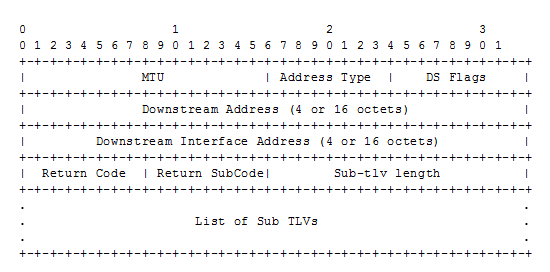
The DDMAP TLV format is derived from the DSMAP TLV format. The key change is that variable length and optional fields have been converted into sub-TLVs. The fields have the same use and meaning as in RFC 4379 as shown in Figure 23.
Figure 23: FEC Stack Change Sub-TLV
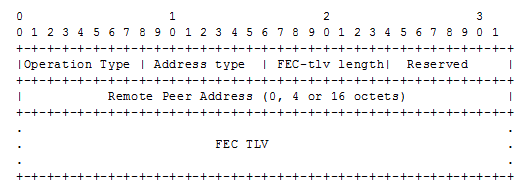
The operation type specifies the action associated with the FEC stack change. The following operation types are defined.
More details on the processing of the fields of the FEC stack change sub-TLV are provided later in this section.
The user can configure which downstream mapping TLV to use globally on a system by using the following command:
configure test-oam mpls-echo-request-downstream-map {dsmap | ddmap}
This command specifies which format of the downstream mapping TLV to use in all LSP trace packets and LDP tree trace packets originated on this node. The Downstream Mapping (DSMAP) TLV is the original format in RFC 4379 and is the default value. The Downstream Detailed Mapping (DDMAP) TLV is the new enhanced format specified in RFC 6424.
This command applies to LSP trace of an RSVP P2P LSP, a MPLS-TP LSP, a BGP IPv4 Label Route, or LDP unicast FEC, and to LDP tree trace of a unicast LDP FEC. It does not apply to LSP trace of an RSVP P2MP LSP which always uses the DDMAP TLV.
The global DSMAP/DDMAP setting impacts the behavior of both OAM LSP trace packets and SAA test packets of type lsp-trace and is used by the sender node when one of the following events occurs:
- An SAA test of type lsp-trace is created (not modified) and no value is specified for the per-test downstream-map-tlv {dsmap|ddmap|none} option. In this case the SAA test downstream-map-tlv value defaults to the global mpls-echo-request-downstream-map value.
- An OAM test of type lsp-trace test is executed and no value is specified for the per-test downstream-map-tlv {dsmap|ddmap|none} option. In this case, the OAM test downstream-map-tlv value defaults to the global mpls-echo-request-downstream-map value.
A consequence of the rules above is that a change to the value of mpls-echo-request-downstream-map option does not affect the value inserted in the downstream mapping TLV of existing tests.
The following are the details of the processing of the new DDMAP TLV:
- When either the DSMAP TLV or the DDMAP TLV is received in an echo request message, the responder node will include the same type of TLV in the echo reply message with the proper downstream interface information and label stack information.
- If an echo request message without a Downstream Mapping TLV (DSMAP or DDMAP) expires at a node which is not the egress for the target FEC stack, the responder node always includes the DSMAP TLV in the echo reply message. This can occur in the following cases:
- The user issues a LSP trace from a sender node with a min-ttl value higher than 1 and a max-ttl value lower than the number of hops to reach the egress of the target FEC stack. This is the sender node behavior when the global configuration or the per-test setting of the DSMAP/DDMAP is set to DSMAP.
- The user issues a LSP ping from a sender node with a ttl value lower than the number of hops to reach the egress of the target FEC stack. This is the sender node behavior when the global configuration of the DSMAP/DDMAP is set to DSMAP.
- The behavior in (a) is changed when the global configuration or the per-test setting of the Downstream Mapping TLV is set to DDMAP. The sender node will include in this case the DDMAP TLV with the Downstream IP address field set to the all-routers multicast address as per Section 3.3 of RFC 4379. The responder node then bypasses the interface and label stack validation and replies with a DDMAP TLV with the correct downstream information for the target FEC stack.
- A sender node never includes the DSMAP or DDMAP TLV in an lsp-ping message.
Using DDMAP TLV in LSP Stitching and LSP Hierarchy
In addition to performing the same features as the DSMAP TLV, the new DDMAP TLV addresses the following scenarios:
- Full validation of an LDP FEC stitched to a BGP IPv4 label route. In this case, the LSP trace message is inserted from the LDP LSP segment or from the stitching point.
- Full validation of a BGP IPv4 label route stitched to an LDP FEC. The LSP trace message is inserted from the BGP LSP segment or from the stitching point.
- Full validation of an LDP FEC which is stitched to a BGP LSP and stitched back into an LDP FEC. In this case, the LSP trace message is inserted from the LDP segments or from the stitching points.
- Full validation of an LDP FEC tunneled over an RSVP LSP using LSP trace.
- Full validation of a BGP IPv4 label route tunneled over an RSVP LSP or an LDP FEC.
In order to properly check a target FEC which is stitched to another FEC (stitching FEC) of the same or a different type, or which is tunneled over another FEC (tunneling FEC), it is necessary for the responding nodes to provide details about the FEC manipulation back to the sender node. This is achieved via the use of the new FEC stack change sub-TLV in the Downstream Detailed Mapping TLV (DDMAP) defined in RFC 6424.
When the user configures the use of the DDMAP TLV on a trace for an LSP that does not undergo stitching or tunneling operation in the network, the procedures at the sender and responder nodes are the same as in the case of the existing DSMAP TLV.
This feature however introduces changes to the target FEC stack validation procedures at the sender and responder nodes in the case of LSP stitching and LSP hierarchy. These changes pertain to the processing of the new FEC stack change sub-TLV in the new DDMAP TLV and the new return code 15 Label switched with FEC change. The following is a description of the main changes which are a superset of the rules described in Section 4 of RFC 6424 to allow greater scope of interoperability with other vendor implementations.
Responder Node Procedures
- As a responder node, the router will always insert a global return code return code of either3 Replying router is an egress for the FEC at stack-depth <RSC> or14 See DDMAP TLV for Return Code and Return Subcode.
- When the responder node inserts a global return code of 3, it will not include a DDMAP TLV.
- When the responder node includes the DDMAP TLV, it inserts a global return code 14 See DDMAP TLV for Return Code and Return Subcode and:
- On a success response, include a return code of 15 in the DDMAP TLV for each downstream which has a FEC stack change TLV.
- On a success response, include a return code 8 Label switched at stack-depth <RSC> in the DDMAP TLV for each downstream if no FEC stack change sub-TLV is present.
- On a failure response, include an appropriate error return code in the DDMAP TLV for each downstream.
- A tunneling node indicates that it is pushing a FEC (the tunneling FEC) on top of the target FEC stack TLV by including a FEC stack change sub-TLV in the DDMAP TLV with a FEC operation type value of PUSH. It also includes a return code 15 Label switched with FEC change. The downstream interface address and downstream IP address fields of the DDMAP TLV are populated for the pushed FEC. The remote peer address field in the FEC stack change sub-TLV is populated with the address of the control plane peer for the pushed FEC. The Label stack sub-TLV provides the full label stack over the downstream interface.
- A node that is stitching a FEC indicates that it is performing a POP operation for the stitched FEC followed by a PUSH operation for the stitching FEC and potentially one PUSH operation for the transport tunnel FEC. It will thus include two or more FEC stack change sub-TLVs in the DDMAP TLV in the echo reply message. It also includes and a return code 15 Label switched with FEC change. The downstream interface address and downstream address fields of the DDMAP TLV are populated for the stitching FEC. The remote peer address field in the FEC stack change sub-TLV of type POP is populated with a null value (0.0.0.0). The remote peer address field in the FEC stack change sub-TLV of type PUSH is populated with the address of the control plane peer for the tunneling FEC. The Label stack sub-TLV provides the full label stack over the downstream interface.
- If the responder node is the egress for one or more FECs in the target FEC Stack, then it must reply with no DDMAP TLV and with a return code 3 Replying router is an egress for the FEC at stack-depth <RSC>. RSC must be set to the depth of the topmost FEC. This operation is iterative in a sense that at the receipt of the echo reply message the sender node will pop the topmost FEC from the target stack FEC TLV and resend the echo request message with the same TTL value as explained in (5) below. The responder node will thus perform exactly the same operation as described in this step until all FECs are popped or until the topmost FEC in the target FEC stack TLV matches the tunneled or stitched FEC. In the latter case, processing of the target FEC stack TLV follows again steps (1) or (2).
Sender Node Procedures
- If the echo reply message contains the return code 14 See DDMAP TLV for Return Code and Return Subcode and the DDMAP TLV has a return code 15 Label switched with FEC change, the sender node adjusts the target FEC Stack TLV in the echo request message for the next value of the TTL to reflect the operation on the current target FEC stack as indicated in the FEC stack change sub-TLV received in the DDMAP TLV of the last echo reply message. In other words, one FEC is popped at most and one or more FECs are pushed as indicated.
- If the echo reply message contains the return code 3 Replying router is an egress for the FEC at stack-depth <RSC>, then:
- If the value for the label stack depth specified in the Return Sub-Code (RSC) field is the same as the depth of current target FEC Stack TLV, then the sender node considers the trace operation complete and terminates it. A responder node will cause this case to occur as per step (6) of the responder node procedures.
- If the value for the label stack depth specified in the Return Sub-Code (RSC) field is different from the depth of the current target FEC Stack TLV, the sender node must continue the LSP trace with the same TTL value after adjusting the target FEC stack TLV by removing the top FEC. Note that this step will continue iteratively until the value for the label stack depth specified in the Return Sub-Code (RSC) field is the same as the depth of current target FEC Stack TLV and in which case step (a) is performed. A responder node will cause this case to occur as per step (6) of the responder node procedures.
- If a DDMAP TLV with or without a FEC stack change sub-TLV is included, then the sender node must ignore it and processing is performed as per steps (a) or (b) above. A responder node will not cause this case to occur but a third party implementation may do.
- As a sender node, the router can accept an echo-reply message with the global return code of either 14 (with DDMAP TLV return code of 15 or 8), or15 and process properly the FEC stack change TLV as per step (1) of the sender node procedures.
- If an LSP ping is performed directly to the egress LER of the stitched FEC, there is no DDMAP TLV included in the echo request message and thus the responder node, which is the egress node, will still reply with return code 4 Replying router has no mapping for the FEC at stack- depth <RSC>. This case cannot be resolved with this feature.
- Note the following limitation when a BGP IPv4 label route is resolved to an LDP FEC which itself is resolved to an RSVP LSP all on the same node. This 2-level LSP hierarchy is not supported as a feature on the SROS but user is not prevented from configuring it. In that case, user and OAM packets are forwarded by the sender node using two labels (T-LDP and BGP). The LSP trace will fail on the downstream node with return code 1 Malformed echo request received since there is no label entry for the RSVP label.
LDP Tree Trace: End-to-End Testing of Paths in an LDP ECMP Network
Figure 24 shows an IP/MPLS network which uses LDP ECMP for network resilience. Faults that are detected through IGP and/or LDP are corrected as soon as IGP and LDP re-converge. The impacted traffic will be forwarded on the next available ECMP path as determined by the hash routine at the node that had a link failure.
Figure 24: Network Resilience Using LDP ECMP
However, there are faults which the IGP/LDP control planes may not detect. These faults may be due to a corruption of the control plane state or of the data plane state in a node. Although these faults are very rare and mostly due to misconfiguration, the LDP Tree Trace OAM feature is intended to detect these “silent” data plane and control plane faults. For example, it is possible that the forwarding plane of a node has a corrupt Next Hop Label Forwarding Entry (NHLFE) and keeps forwarding packets over an ECMP path only to have the downstream node discard them. This data plane fault can only be detected by an OAM tool that can test all possible end-to-end paths between the ingress LER and the egress LER. A corruption of the NLHFE entry can also result from a corruption in the control plane at that node.
LDP ECMP Tree Building
When the LDP tree trace feature is enabled, the ingress LER builds the ECM tree for a given FEC (egress LER) by sending LSP trace messages and including the LDP IPv4 Prefix FEC TLV as well as the downstream mapping TLV.In order to build the ECMP tree, the router LER inserts an IP address range drawn from the 127/8 space. When received by the downstream LSR, it will use this range to determine which ECMP path is exercised by any IP address or a sub-range of addresses within that range based on its internal hash routine. When the MPLS echo reply is received by the router LER, it will record this information and proceed with the next echo request message targeted for a node downstream of the first LSR node along one of the ECMP paths. The sub-range of IP addresses indicated in the initial reply will be used since the objective is to have the LSR downstream of the router LER pass this message to its downstream node along the first ECMP path.
The following figure illustrates the behavior through the following example adapted from RFC 4379, Detecting Multi-Protocol Label Switched (MPLS) Data Plane Failures:
LSR A has two downstream LSRs, B and F, for PE2 FEC. PE1 receives an echo reply from A with the Multipath Type set to 4, with low/high IP addresses of 127.1.1.1->127.1.1.255 for downstream LSR B and 127.2.1.1->127.2.1.255 for downstream LSR F. PE1 reflects this information to LSR B. B, which has three downstream LSRs, C, D, and E, computes that 127.1.1.1->127.1.1.127 would go to C and 127.1.1.128-> 127.1.1.255 would go to D. B would then respond with 3 Downstream Mappings: to C, with Multipath Type 4 (127.1.1.1->127.1.1.127); to D, with Multipath Type 4 (127.1.1.127->127.1.1.255); and to E, with Multipath Type 0.
The router supports multipath type 0 and 8, and up to a maximum of 36 bytes for the multipath length and supports the LER part of the LDP ECMP tree building feature.
A user configurable parameter sets the frequency of running the tree trace capability. The minimum and default value is 60 minutes and the increment is 1 hour.
The router LER gets the list of FECs from the LDP FEC database. New FECs will be added to the discovery list at the next tree trace and not when they are learned and added into the FEC database. The maximum number of FECs to be discovered with the tree building feature is limited to 500. The user can configure FECs to exclude the use of a policy profile.
Periodic Path Exercising
The periodic path exercising capability of the LDP tree trace feature runs in the background to test the LDP ECMP paths discovered by the tree building capability. The probe used is an LSP ping message with an IP address drawn from the sub-range of 127/8 addresses indicated by the output of the tree trace for this FEC.
The periodic LSP ping messages continuously probes an ECMP path at a user configurable rate of at least 1 message per minute. This is the minimum and default value. The increment is 1 minute. If an interface is down on a router LER, then LSP ping probes that normally go out this interface will not be sent.
The LSP ping routine updates the content of the MPLS echo request message, specifically the IP address, as soon as the LDP ECMP tree trace has output the results of a new computation for the path in question.
LSP Ping for RSVP P2MP LSP (P2MP)
The P2MP LSP ping complies to RFC 6425, Detecting Data Plane Failures in Point-to-Multipoint Multiprotocol Label Switching (MPLS) - Extensions to LSP Ping.
An LSP ping can be generated by entering the following OAM command:
The echo request message is sent on the active P2MP instance and is replicated in the data path over all branches of the P2MP LSP instance. By default, all egress LER nodes which are leaves of the P2MP LSP instance will reply to the echo request message.
The user can reduce the scope of the echo reply messages by explicitly entering a list of addresses for the egress LER nodes that are required to reply. A maximum of 5 addresses can be specified in a single execution of the p2mp-lsp-ping command. If all 5 egress LER nodes are router nodes, they will be able to parse the list of egress LER addresses and will reply. Note that RFC 6425 specifies that only the top address in the P2MP egress identifier TLV must be inspected by an egress LER. When interoperating with other implementations, the router egress LER will respond if its address is anywhere in the list. Furthermore, if another vendor implementation is the egress LER, only the egress LER matching the top address in the TLV may respond.
If the user enters the same egress LER address more than once in a single p2mp-lsp-ping command, the head-end node displays a response to a single one and displays a single error warning message for the duplicate ones. When queried over SNMP, the head-end node issues a single response trap and issues no trap for the duplicates.
The timeout parameter should be set to the time it would take to get a response from all probed leaves under no failure conditions. For that purpose, its range extends to 120 seconds for a p2mp-lsp-ping from a 10 second lsp-ping for P2P LSP. The default value is 10 seconds.
The router head-end node displays a “Send_Fail” error when a specific S2L path is down only if the user explicitly listed the address of the egress LER for this S2L in the ping command.
Similarly, the router head-end node displays the timeout error when no response is received for an S2L after the expiry of the timeout timer only if the user explicitly listed the address of the egress LER for this S2L in the ping command.
The user can configure a specific value of the ttl parameter to force the echo request message to expire on a router branch node or a bud LSR node. The latter replies with a downstream mapping TLV for each branch of the P2MP LSP in the echo reply message. Note that a maximum of 16 downstream mapping TLVs can be included in a single echo reply message. It also sets the multipath type to zero in each downstream mapping TLV and will thus not include any egress address information for the reachable egress LER nodes for this P2MP LSP.
If the router ingress LER node receives the new multipath type field with the list of egress LER addresses in an echo reply message from another vendor implementation, it will ignore but will not cause an error in processing the downstream mapping TLV.
If the ping expires at an LSR node which is performing a re-merge or cross-over operation in the data path between two or more ILMs of the same P2MP LSP, there will be an echo reply message for each copy of the echo request message received by this node.
The output of the command without the detail parameter specified provides a high-level summary of error codes and/or success codes received.
The output of the command with the detail parameter specified shows a line for each replying node as in the output of the LSP ping for a P2P LSP.
The display is delayed until all responses are received or the timer configured in the timeout parameter expired. No other CLI commands can be entered while waiting for the display. A control-C (^C) command will abort the ping operation.
For more information about P2MP refer to the MPLS Guide.
LSP Trace for RSVP P2MP LSP
The P2MP LSP trace complies to RFC 6425. An LSP trace can be generated by entering the following OAM command:
The LSP trace capability allows the user to trace the path of a single S2L path of a P2MP LSP. Its operation is similar to that of the p2mp-lsp-ping command but the sender of the echo reply request message includes the downstream mapping TLV to request the downstream branch information from a branch LSR or bud LSR. The branch LSR or bud LSR will then also include the downstream mapping TLV to report the information about the downstream branches of the P2MP LSP. An egress LER does not include this TLV in the echo response message.
The probe-count parameter operates in the same way as in LSP trace on a P2P LSP. It represents the maximum number of probes sent per TTL value before giving up on receiving the echo reply message. If a response is received from the traced node before reaching maximum number of probes, then no more probes are sent for the same TTL. The sender of the echo request then increments the TTL and uses the information it received in the downstream mapping TLV to start sending probes to the node downstream of the last node which replied. This continues until the egress LER for the traced S2L path replied.
Since the command traces a single S2L path, the timeout and interval parameters keep the same value range as in LSP trace for a P2P LSP.
The P2MP LSP Trace makes use of the Downstream Detailed Mapping (DDMAP) TLV. The following excerpt from RFC 6424 details the format of the new DDMAP TLV entered in the path-destination belongs to one of the possible outgoing interface of the FEC.
The Downstream Detailed Mapping TLV format is derived from the Downstream Mapping (DSMAP) TLV format. The key change is that variable length and optional fields have been converted into sub-TLVs. The fields have the same use and meaning as in RFC 4379.
Similar to p2mp-lsp-ping, an LSP trace probe results on all egress LER nodes eventually receiving the echo request message but only the traced egress LER node will reply to the last probe.
Also any branch LSR node or bud LSR node in the P2MP LSP tree may receive a copy of the echo request message with the TTL in the outer label expiring at this node. However, only a branch LSR or bud LSR which has a downstream branch over which the traced egress LER is reachable must respond.
When a branch LSR or BUD LSR node responds to the sender of the echo request message, it sets the global return code in the echo response message to RC=14 - "See DDMAP TLV for Return Code and Return Sub-Code" and the return code in the DDMAP TLV corresponding to the outgoing interface of the branch used by the traced S2L path to RC=8 - "Label switched at stack-depth <RSC>".
Since a single egress LER address, for example an S2L path, can be traced, the branch LSR or bud LSR node will set the multipath type of zero in the downstream mapping TLV in the echo response message as no egress LER address need to be included.
LSP Trace Behavior When S2L Path Traverses a Re-Merge Node
When a 7450 ESS, 7750 SR or 7950 XRS LSR performs a re-merge of one or more ILMs of the P2MP LSP to which the traced S2L sub-LSP belongs, it may block the ILM over which the traced S2L resides. This causes the trace to either fail or to succeed with a missing hop.
The following is an example of this behavior.
S2L1 and S2L2 use ILMs which re-merge at node B. Depending of which ILM is blocked at B, the TTL=2 probe will either yield two responses or will timeout.
- Tracing S2L1 when ILM on interface C-B blocked at node B:For TTL=1, A gets a response from C only as B does not have S2L1 on the ILM on interface A-B.For TTL=2, assume A gets first the response from B which indicates a success. It then builds the next probe with TTL=3. B will only pass the copy of the message arriving on interface A-B and will drop the one arriving on interface C-B (treats it like a data packet since it does not expire at node B). This copy will expire at F. However F will return a "DSMappingMismatched" error because the DDMAP TLV was the one provided by node B in TTL=2 step. The trace will abort at this point in time. However, A knows it got a second response from Node D for TTL=2 with a "DSMappingMismatched" error.If A gets the response from D first with the error code, it waits to see if it gets a response from B or it times out. In either case, it will log this status as multiple replies received per probe in the last probe history and aborts the trace.
- Tracing S2L2 when ILM on interface A-B blocked at node B:For TTL=1, B responds with a success. C does not respond as it does not have an ILM for S2L2.For TTL=2, B drops the copy coming on interface A-B. It receives a copy coming on interface B-C but will drop it as the ILM does not contain S2L2. Node A times out. Next, node A generates a probe with TTL=3 without a DDMAP TLV. This time node D will respond with a success and will include its downstream DDMAP TLV to node E. The rest of the path will be discovered correctly. The traced path for S2L2 will look something like: A-B-(*)-D-E.
The router ingress LER detects a re-merge condition when it receives two or more replies to the same probe, such as the same TTL value. It displays the following message to the user regardless if the trace operation successfully reached the egress LER or was aborted earlier:
This warning message indicates to the user the potential of a re-merge scenario and that a p2mp-lsp-ping command for this S2L should be used to verify that the S2L path is not defective.
The router ingress LER behavior is to always proceed to the next ttl probe when it receives an OK response to a probe or when it times out on a probe. If however it receives replies with an error return code, it must wait until it receives an OK response or it times out. If it times out without receiving an OK reply, the LSP trace must be aborted.
The following are possible echo reply messages received and corresponding ingress LER behavior:
- One or more error return codes + OK: display OK return code. Proceed to next ttl probe. Display warning message at end of trace.
- OK + One or more error return codes: display OK return code. Proceed to next ttl probe right after receiving the OK reply but keep state that more replies received. Display warning message at end of trace.
- OK + OK: should not happen for re-merge but would continue trace on 1st OK reply. This is the case when one of the branches of the P2MP LSP is activating the P2P bypass LSP. In this case, the head-end node will get a reply from both a regular P2MP LSR which has the ILM for the traced S2L and from an LSR switching the P2P bypass for other S2Ls. The latter does not have context for the P2MP LSP being tunneled but will respond after doing a label stack validation.
- One error return code + timeout: abort LSP trace and display error code. Ingress LER cannot tell the error is due to a re-merge condition.
- More than one error return code + timeout: abort LSP trace and display first error code. Display warning message at end of trace.
- Timeout on probe without any reply: display “*” and proceed to next ttl probe.
Tunneling of ICMP Reply Packets over MPLS LSP
This feature enables the tunneling of ICMP reply packets over MPLS LSP at an LSR node as per RFC 3032. At an LSR node, including an ABR, ASBR, or data path Router Reflector (RR) node, the user enables the ICMP tunneling feature globally on the system using the config>router>icmp-tunneling command.
The LSR part of this feature consists of crafting the reply ICMP packet of type=11- 'time exceeded', with a source address set to a local address of the LSR node, and appending the IP header and leading payload octets of the original datagram. The system skips the lookup of the source address of the sender of the label TTL expiry packet, which becomes the destination address of the ICMP reply packet. Instead, CPM injects the ICMP reply packet in the forward direction of the MPLS LSP the label TTL expiry packet was received from. The TTL of pushed labels should be set to 255.
The source address of the ICMP reply packet is determined as follows:
- The LSR uses the address of the outgoing interface for the MPLS LSP. Note that with LDP LSP or BGP LSP, multiple ECMP next-hops can exist in which case the first outgoing interface is selected.
- If the interface does not have an address of the same family (IPv4 or IPv6) as the ICMP packet, then the system address of the same family is selected. If one is not configured, the packet is dropped.
When the packet is received by the egress LER, it performs a regular user packet lookup in the data path in the GRT context for BGP shortcut, 6PE, and BGP label route prefixes, or in VPRN context for VPRN and 6VPE prefixes. It then forwards it to the destination, which is the sender of the original packet which TTL expired at the LSR.
If the egress LER does not have a route to the destination of the ICMP packet, it drops the packets.
The rate of the tunneled ICMP replies at the LSR can be directly or indirectly controlled by the existing IOM level and CPM levels mechanisms. Specifically, the rate of the incoming UDP traceroute packets received with a label stack can be controlled at ingress IOM using the distributed CPU protection feature. The rate of the ICMP replies by CPM can also be directly controlled by configuring a system wide rate limit for packets ICMP replies to MPLS expired packets which are successfully forwarded to CPM using the command 'configure system security vprn-network-exceptions'. Note that while this command's name refers to VPRN service, this feature rate limits ICMP replies for packets received with any label stack, including VPRN and shortcuts.
The 7450 ESS, 7750 SR and 7950 XRS router implementation supports appending to the ICMP reply of type Time Exceeded the MPLS label stack object defined in RFC 4950. It does not include it in the ICMP reply type of Destination unreachable.
The new MPLS Label Stack object permits an LSR to include label stack information including label value, EXP, and TTL field values, from the encapsulation header of the packet that expired at the LSR node. The ICMP message continues to include the IP header and leading payload octets of the original datagram.
In order to include the MPLS Label Stack object, the SR OS implementation adds support of RFC 4884 which defines extensions for a multi-part ICMPv4/v6 message of type Time Exceeded. Section 5 of RFC 4884 defines backward compatibility of the new ICMP message with extension header with prior standard and proprietary extension headers.
In order to guarantee interoperability with third party implementations deployed in customer networks, the router implementation is able to parse in the receive side all possible encapsulations formats as defined in Section 5 of RFC 4884. Specifically:
The new MPLS Label Stack object permits an LSR to include label stack information including label value, EXP, and TTL field values, from the encapsulation header of the packet that expired at the LSR node. The ICMP message continues to include the IP header and leading payload octets of the original datagram.
- If the length attribute is zero, it is treated as a compliant message and the router implementation will process the original datagram field of size equal to 128 bytes and with no extension header.
- If the length attribute is not included, it is treated as a non-compliant message and the router implementation will process the original datagram field of size equal to 128 bytes and also look for a valid extension header following the 128 byte original datagram field. If the extension is valid, it is processed accordingly, if not it is assumed the remainder of the packet is still part of the original datagram field and process it accordingly. Note that the router implementation only validates the ICMP extension version number and not the checksum field in the extension header. The checksum of the main time exceeded message is also not validated as per prior implementation.
- An ICMP reply message will be dropped if it includes more than one MPLS label object. In general when a packet is dropped due to an error in the packet header or structure, the traceroute will timeout and will not display an error message.
- When processing the received ICMP reply packet, an unsupported extension header will be skipped.
In the transmit side, when the MPLS Label Stack object is added as an extension to the ICMP reply message, it is appended to the message immediately following the "original datagram" field taken from the payload of the received traceroute packet. The size of the appended "original datagram" field contains exactly 128 octets. If the original datagram did not contain 128 octets, the "original datagram" field is zero padded to 128 octets.
For sample output of the traceroute OAM tool when the ICMP tunneling feature is enabled see, Traceroute with ICMP Tunneling In Common Applications.
QoS Handling of Tunneled ICMP Reply Packets
When the ICMP reply packet is generated in CPM, its FC is set by default to NC1 with the corresponding default ToS byte value of 0xC0. The DSCP value can be changed by configuring a different value for an ICMP application under the config>router>sgt-qos icmp context.
When the packet is forwarded to the outgoing interface, the packet is queued in the egress network queue corresponding to its CPM assigned FC and profile parameter values. The marking of the packet's EXP is dictated by the {FC, profile}-to-EXP mapping in the network QoS policy configured on the outgoing network interface. The TOS byte, and DSCP value for that matter, assigned by CPM are not modified by the IOM.
Summary of UDP Traceroute Behavior With and Without ICMP Tunneling
At a high level, the major difference in the behavior of the UDP traceroute when ICMP tunneling is enabled at an LSR node is that the LSR node tunnels the ICMP reply packet towards the egress of the LSP without looking up the traceroute sender's address. When ICMP tunneling is disabled, the LSR looks it up and replies if the sender is reachable. However there are additional differences in the two behaviors and they are summarized in the following.
- icmp-tunneling disabled/IPv4 LSP/IPv4 traceroute:
- Ingress LER, egress LER, and LSR attempt to reply to the UDP traceroute of both IPv4 and VPN-IPv4 routes.
- For VPN-IPv4 routes, the LSR will attempt to reply but it may not find a route and in such a case the sender node will timeout. In addition, the ingress and egress ASBR nodes in VRPN inter-AS option B will not respond as in current implementation and the sender will timeout.
- icmp-tunneling disabled/IPv4 LSP/IPv6 traceroute:
- Ingress LER and egress LER reply to traceroute of both IPv6 and VPN-IPv6 routes. LSR does not reply.
- icmp-tunneling enabled/IPv4 LSP/IPv4 traceroute:
- ingress LER and egress LER reply directly to the UDP traceoute of both IPv4 and VPN-IPv4 routes. LSR tunnels the reply to endpoint of the LSP to be forwarded from there to the source of the traceroute.
- For VPN-IPv4 routes, the ingress and egress ASBR nodes in VPRN inter-AS option B will also tunnel the reply to the endpoint of the LSP and as such there is no timeout at the sender node like in the case when icmp-tunneling is disabled.
- icmp-tunneling enabled/IPv4 LSP/IPv6 traceroute:
- ingress LER and egress LER reply directly to the UDP traceoute of both IPv6 and VPN-IPv6 routes. LSR tunnels the reply to endpoint of the LSP to be forwarded from there to the source of the traceroute.
- For VPN-IPv6 routes, the ingress and egress ASBR nodes in VPRN inter-AS option B will also tunnel the reply to the endpoint of the LSP like in the case when icmp-tunneling is disabled.
In the presence of ECMP, CPM generated UDP traceroute packets are not sprayed over multiple ECMP next-hops. The first outgoing interface is selected. In addition, a LSR ICMP reply to a UDP traceroute will also be forwarded over the first outgoing interface regardless if ICMP tunneling is enabled or not. When ICMP tunneling is enabled, it means the packet is tunneled over the first downstream interface for the LSP when multiple next-hops exist (LDP FEC or BGP label route). In all cases, the ICMP reply packet uses the outgoing interface address as the source address of the reply packet.
SDP Diagnostics
The router SDP diagnostics are SDP ping and SDP MTU path discovery.
SDP Ping
SDP ping performs in-band uni-directional or round-trip connectivity tests on SDPs. The SDP ping OAM packets are sent in-band, in the tunnel encapsulation, so it will follow the same path as traffic within the service. The SDP ping response can be received out-of-band in the control plane, or in-band using the data plane for a round-trip test.
For a uni-directional test, SDP ping tests:
- Egress SDP ID encapsulation
- Ability to reach the far-end IP address of the SDP ID within the SDP encapsulation
- Path MTU to the far-end IP address over the SDP ID
- Forwarding class mapping between the near-end SDP ID encapsulation and the far-end tunnel termination
For a round-trip test, SDP ping uses a local egress SDP ID and an expected remote SDP ID. Since SDPs are uni-directional tunnels, the remote SDP ID must be specified and must exist as a configured SDP ID on the far-end router SDP round trip testing is an extension of SDP connectivity testing with the additional ability to test:
- Remote SDP ID encapsulation
- Potential service round trip time
- Round trip path MTU
- Round trip forwarding class mapping
SDP MTU Path Discovery
In a large network, network devices can support a variety of packet sizes that are transmitted across its interfaces. This capability is referred to as the Maximum Transmission Unit (MTU) of network interfaces. It is important to understand the MTU of the entire path end-to-end when provisioning services, especially for virtual leased line (VLL) services where the service must support the ability to transmit the largest customer packet.
The Path MTU discovery tool provides a powerful tool that enables service provider to get the exact MTU supported by the network's physical links between the service ingress and service termination points (accurate to one byte).
Service Diagnostics
-Alcatel-Lucent’s Service ping feature provides end-to-end connectivity testing for an individual service. Service ping operates at a higher level than the SDP diagnostics in that it verifies an individual service and not the collection of services carried within an SDP.
Service ping is initiated from a router to verify round-trip connectivity and delay to the far-end of the service. -Alcatel-Lucent’s implementation functions for both GRE and MPLS tunnels and tests the following from edge-to-edge:
- Tunnel connectivity
- VC label mapping verification
- Service existence
- Service provisioned parameter verification
- Round trip path verification
- Service dynamic configuration verification
VPLS MAC Diagnostics
While the LSP ping, SDP ping and service ping tools enable transport tunnel testing and verify whether the correct transport tunnel is used, they do not provide the means to test the learning and forwarding functions on a per-VPLS-service basis.
It is conceivable, that while tunnels are operational and correctly bound to a service, an incorrect Forwarding Information Base (FIB) table for a service could cause connectivity issues in the service and not be detected by the ping tools. Alcatel-Lucent has developed VPLS OAM functionality to specifically test all the critical functions on a per-service basis. These tools are based primarily on the IETF document draft-stokes-vkompella-ppvpn-hvpls-oam-xx.txt, Testing Hierarchical Virtual Private LAN Services.
The VPLS OAM tools are:
- MAC Ping — Provides an end-to-end test to identify the egress customer-facing port where a customer MAC was learned. MAC ping can also be used with a broadcast MAC address to identify all egress points of a service for the specified broadcast MAC.
- MAC Trace — Provides the ability to trace a specified MAC address hop-by-hop until the last node in the service domain. An SAA test with MAC trace is considered successful when there is a reply from a far-end node indicating that they have the destination MAC address on an egress SAP or the CPM.
- CPE Ping — Provides the ability to check network connectivity to the specified client device within the VPLS. CPE ping will return the MAC address of the client, as well as the SAP and PE at which it was learned.
- MAC Populate — Allows specified MAC addresses to be injected in the VPLS service domain. This triggers learning of the injected MAC address by all participating nodes in the service. This tool is generally followed by MAC ping or MAC trace to verify if correct learning occurred.
- MAC Purge — Allows MAC addresses to be flushed from all nodes in a service domain.
MAC Ping
For a MAC ping test, the destination MAC address (unicast or multicast) to be tested must be specified. A MAC ping packet is sent through the data plane. The ping packet goes out with the data plane format.
In the data plane, a MAC ping is sent with a VC label TTL of 255. This packet traverses each hop using forwarding plane information for next hop, VC label, etc. The VC label is swapped at each service-aware hop, and the VC TTL is decremented. If the VC TTL is decremented to 0, the packet is passed up to the management plane for processing. If the packet reaches an egress node, and would be forwarded out a customer facing port, it is identified by the OAM label below the VC label and passed to the management plane.
MAC pings are flooded when they are unknown at an intermediate node. They are responded to only by the egress nodes that have mappings for that MAC address.
MAC Trace
A MAC trace functions like an LSP trace with some variations. Operations in a MAC trace are triggered when the VC TTL is decremented to 0.
Like a MAC ping, a MAC trace is sent via the data plane.
When a traceroute request is sent via the data plane, the data plane format is used. The reply can be via the data plane or the control plane.
A data plane MAC traceroute request includes the tunnel encapsulation, the VC label, and the OAM, followed by an Ethernet DLC, a UDP and IP header. If the mapping for the MAC address is known at the sender, then the data plane request is sent down the known SDP with the appropriate tunnel encapsulation and VC label. If it is not known, then it is sent down every SDP (with the appropriate tunnel encapsulation per SDP and appropriate egress VC label per SDP binding).
The tunnel encapsulation TTL is set to 255. The VC label TTL is initially set to the min-ttl (default is 1). The OAM label TTL is set to 2. The destination IP address is the all-routers multicast address. The source IP address is the system IP of the sender.
The destination UDP port is the LSP ping port. The source UDP port is whatever the system gives (note that this source UDP port is really the demultiplexor that identifies the particular instance that sent the request, when correlating the reply).
The Reply Mode is either 3 (i.e., reply via the control plane) or 4 (i.e., reply through the data plane), depending on the reply-control option. By default, the data plane request is sent with Reply Mode 3 (control plane reply).
The Ethernet DLC header source MAC address is set to either the system MAC address (if no source MAC is specified) or to the specified source MAC. The destination MAC address is set to the specified destination MAC. The EtherType is set to IP.
CPE Ping
The MAC ping OAM tool makes it possible to detect whether a particular MAC address has been learned in a VPLS.
The cpe-ping command extends this capability to detecting end-station IP addresses inside a VPLS. A CPE ping for a specific destination IP address within a VPLS will be translated to a MAC-ping towards a broadcast MAC address. Upon receiving such a MAC ping, each peer PE within the VPLS context will trigger an ARP request for the specific IP address. The PE receiving a response to this ARP request will report back to the requesting router. It is encouraged to use the source IP address of 0.0.0.0 to prevent the provider’s IP address of being learned by the CE.
CPE Ping for PBB Epipe
CPE ping has been supported for VPLS services since Release 3.0 of SR OS. It enables the connectivity of the access circuit between a VPLS PE and a CPE to be tested, even if the CPE is unmanaged, and therefor the service provider cannot run standardized Ethernet OAM to the CPE. The command “cpe-ping” for a specific destination IP address within a VPLS is translated into a MAC-ping towards a broadcast MAC address. All destinations within the VPLS context are reached by this ping to the broadcast the MAC address. At all these destinations, an ARP will be triggered for the specific IP address (with the IP destination address equals to the address from the request, mac-da equals to all1's, mac-sa equals to the CPM-mac-address and the IP source address, which is the address found in the request). The destination receiving a response will reply back to the requester.
Release 10.0 extended the CPE ping command for local, distributed, and PBB Epipe services provisioned over a PBB VPLS. CPE ping for Epipe implements an alternative behavior to CPE ping for VPLS that enables fate sharing of the CPE ping request with the Epipe service. Any PE within the epipe service (the source PE) can launch the CPE ping. The source PE builds an arp request and encapsulates it to be sent in the epipe as if it came from a customer device by using its chassis MAC as the source MAC address. The ARP request then egresses the remote PE device as any other packets on the epipe. The remote CPE device responds to the ARP and the reply is transparently sent on the epipe towards the source PE. The source PE will then look for a match on its chassis MAC in the inner customer DA. If a match is found, the source PE device intercepts this response packet.
This method is supported regardless of whether the network uses SDPs or SAPs. It is configured using the existing oam>cpe-ping CLI command.
| Note:
This feature does not support IPv6 CPEs. |
Hardware Support
This feature supports IOM3 and above and applies only to the 7450 ESS and 7750 SR.
Any IOM3-supporting mode are subjected to the following check.
To launch cpe-ping on an Epipe, all of the following must be true:
- All SAPs on the Epipe must be provisioned on slots that are mode-d compatible.
- If bound to a PBB tunnel, all SAPs on the B-VPLS must be provisioned on slots that are mode-d compatible.
- If the Epipe or the B-VPLS (in the case of PBB Epipe) uses SDP-bindings then the system configuration must be network-chassis-mode-d compatible.
MAC Populate
MAC populate is used to send a message through the flooding domain to learn a MAC address as if a customer packet with that source MAC address had flooded the domain from that ingress point in the service. This allows the provider to craft a learning history and engineer packets in a particular way to test forwarding plane correctness.
The MAC populate request is sent with a VC TTL of 1, which means that it is received at the forwarding plane at the first hop and passed directly up to the management plane. The packet is then responded to by populating the MAC address in the forwarding plane, like a conventional learn although the MAC will be an OAM-type MAC in the FIB to distinguish it from customer MAC addresses.
This packet is then taken by the control plane and flooded out the flooding domain (squelching appropriately, the sender and other paths that would be squelched in a typical flood).
This controlled population of the FIB is very important to manage the expected results of an OAM test. The same functions are available by sending the OAM packet as a UDP/IP OAM packet. It is then forwarded to each hop and the management plane has to do the flooding.
Options for MAC populate are to force the MAC in the table to type OAM (in case it already existed as dynamic or static or an OAM induced learning with some other binding), to prevent new dynamic learning to over-write the existing OAM MAC entry, to allow customer packets with this MAC to either ingress or egress the network, while still using the OAM MAC entry.
Finally, an option to flood the MAC populate request causes each upstream node to learn the MAC, for example, populate the local FIB with an OAM MAC entry, and to flood the request along the data plane using the flooding domain.
An age can be provided to age a particular OAM MAC after a different interval than other MACs in a FIB.
MAC Purge
MAC purge is used to clear the FIBs of any learned information for a particular MAC address. This allows one to do a controlled OAM test without learning induced by customer packets. In addition to clearing the FIB of a particular MAC address, the purge can also indicate to the control plane not to allow further learning from customer packets. This allows the FIB to be clean, and be populated only via a MAC Populate.
MAC purge follows the same flooding mechanism as the MAC populate.
VLL Diagnostics
VCCV Ping
VCCV ping is used to check connectivity of a VLL in-band. It checks that the destination (target) PE is the egress for the Layer 2 FEC. It provides a cross-check between the data plane and the control plane. It is in-band, meaning that the VCCV ping message is sent using the same encapsulation and along the same path as user packets in that VLL. This is equivalent to the LSP ping for a VLL service. VCCV ping reuses an LSP ping message format and can be used to test a VLL configured over an MPLS and GRE SDP.
VCCV-Ping Application
VCCV effectively creates an IP control channel within the pseudowire between PE1 and PE2. PE2 should be able to distinguish on the receive side VCCV control messages from user packets on that VLL. There are three possible methods of encapsulating a VCCV message in a VLL which translates into three types of control channels:
- Use of a Router Alert Label immediately above the VC label. This method has the drawback that if ECMP is applied to the outer LSP label (for example, transport label), the VCCV message will not follow the same path as the user packets. This effectively means it will not troubleshoot the appropriate path. This method is supported by the 7450 ESS, 7750 SR, and 7950 XRS routers.
- Use of the OAM control word as shown:
The first nibble is set to 0x1. The Format ID and the reserved fields are set to 0 and the channel type is the code point associated with the VCCV IP control channel as specified in the PWE3 IANA registry (RFC 4446). The channel type value of 0x21 indicates that the Associated Channel carries an IPv4 packet.
The use of the OAM control word assumes that the draft-martini control word is also used on the user packets. This means that if the control word is optional for a VLL and is not configured, the PE node will only advertise the router alert label as the CC capability in the Label Mapping message. This method is supported by the 7450 ESS, 7750 SR and 7950 XRS routers.
- Set the TTL in the VC label to 1 to force PE2 control plane to process the VCCV message. This method is not guaranteed to work under all circumstances. For instance, the draft mentions some implementations of penultimate hop popping overwrite the TTL field. This method is not supported by the 7450 ESS, 7750 SR, and 7950 XRS routers.
When sending the label mapping message for the VLL, PE1 and PE2 must indicate which of the above OAM packet encapsulation methods (for example, which control channel type) they support. This is accomplished by including an optional VCCV TLV in the pseudowire FEC Interface Parameter field. The format of the VCCV TLV is shown below:
Note that the absence of the optional VCCV TLV in the Interface parameters field of the pseudowire FEC indicates the PE has no VCCV capability.
The Control Channel (CC) Type field is a bitmask used to indicate if the PE supports none, one, or many control channel types.
- 0x00 None of the following VCCV control channel types are supported
- 0x01 PWE3 OAM control word
- 0x02 MPLS Router Alert Label
- 0x04 MPLS inner label TTL = 1
If both PE nodes support more than one of the CC types, then the router PE will make use of the one with the lowest type value. For instance, OAM control word will be used in preference to the MPLS router alert label.
The Connectivity Verification (CV) bitmask field is used to indicate the specific type of VCCV packets to be sent over the VCCV control channel. The valid values are:
0x00 None of the below VCCV packet type are supported.
0x01 ICMP ping. Not applicable to a VLL over a MPLS or GRE SDP and as such is not supported by the 7450 ESS, 7750 SR, and 7950 XRS routers.
0x02 LSP ping. This is used in VCCV ping application and applies to a VLL over an MPLS or a GRE SDP. This is supported by the 7450 ESS, 7750 SR, and 7950 XRS routers.
A VCCV ping is an LSP echo request message as defined in RFC 4379. It contains an L2 FEC stack TLV which must include within the sub-TLV type 10 “FEC 128 Pseudowire”. It also contains a field which indicates to the destination PE which reply mode to use. There are four reply modes defined in RFC 4379:
Reply mode, meaning:
- Do not reply. This mode is supported by the routers.
- Reply via an IPv4/IPv6 UDP packet. This mode is supported by the routers.
- Reply with an IPv4/IPv6 UDP packet with a router alert. This mode sets the router alert bit in the IP header and is not be confused with the CC type which makes use of the router alert label. This mode is not supported by the routers.
- Reply via application level control channel. This mode sends the reply message inband over the pseudowire from PE2 to PE1. PE2 will encapsulate the Echo Reply message using the CC type negotiated with PE1. This mode is supported by the routers.
The reply is an LSP echo reply message as defined in RFC 4379. The message is sent as per the reply mode requested by PE1. The return codes supported are the same as those supported in the router LSP ping capability.
The VCCV ping feature is in addition to the service ping OAM feature which can be used to test a service between router nodes. The VCCV ping feature can test connectivity of a VLL with any third party node which is compliant to RFC 5085.
Figure 25: VCCV-Ping Application
VCCV Ping in a Multi-Segment Pseudowire
Figure 26 shows an example of an application of VCCV ping over a multi-segment pseudowire.
Pseudowire switching is a method for scaling a large network of VLL or VPLS services by removing the need for a full mesh of T-LDP sessions between the PE nodes as the number of these nodes grow over time. Pseudowire switching is also used whenever there is a need to deploy a VLL service across two separate routing domains.
In the network, a Termination PE (T-PE) is where the pseudowire originates and terminates. The Switching PE (S-PE) is the node which performs pseudowire switching by cross-connecting two spoke SDPs.
VCCV ping is extended to be able to perform the following OAM function:
- VCCV ping to a destination PE. A VLL FEC ping is a message sent by T-PE1 to test the FEC at T-PE2. The operation at T-PE1 and T-PE2 is the same as in the case of a single-segment pseudowire. The pseudowire switching node, S-PE1, pops the outer label, swaps the inner (VC) label, decrements the TTL of the VC label, and pushes a new outer label. The PE1 node does not process the VCCV OAM Control Word unless the VC label TTL expires. In that case, the message is sent to the CPM for further validation and processing. This is the method described in draft-hart-pwe3-segmented-pw-vccv.
Note that the originator of the VCCV ping message does not need to be a T-PE node; it can be an S-PE node. The destination of the VCCV ping message can also be an S-PE node.
VCCV trace to trace the entire path of a pseudowire with a single command issued at the T-PE. This is equivalent to LSP trace and is an iterative process by which T-PE1 sends successive VCCV ping messages while incrementing the TTL value, starting from TTL=1. The procedure for each iteration is the same as above and each node in which the VC label TTL expires checks the FEC and replies with the FEC to the downstream S-PE or T-PE node. The process is terminated when the reply is from T-PE2 or when a timeout occurs.
Figure 26: VCCV Ping over a Multi-Segment Pseudowire
Automated VCCV-Trace Capability for MS-Pseudowire
Although tracing of the MS-pseudowire path is possible using the methods explained in previous sections, these require multiple manual iterations and that the FEC of the last pseudowire segment to the target T-PE/S-PE be known a priori at the node originating the echo request message for each iteration. This mode of operation is referred to as a “ping” mode.
The automated VCCV-trace can trace the entire path of a pseudowire with a single command issued at the T-PE or at an S-PE. This is equivalent to LSP-trace and is an iterative process by which the ingress T-PE or T-PE sends successive VCCV-ping messages with incrementing the TTL value, starting from TTL=1.
The method is described in draft-hart-pwe3-segmented-pw-vccv, VCCV Extensions for Segmented Pseudo-Wire, and is pending acceptance by the PWE3 working group. In each iteration, the source T-PE or S-PE builds the MPLS echo request message in a way similar to VCCV Ping. The first message with TTL=1 will have the next-hop S-PE T-LDP session source address in the Remote PE Address field in the pseudowire FEC TLV. Each S-PE which terminates and processes the message will include in the MPLS echo reply message the FEC 128 TLV corresponding the pseudowire segment to its downstream node. The inclusion of the FEC TLV in the echo reply message is allowed in RFC 4379, Detecting Multi-Protocol Label Switched (MPLS) Data Plane Failures. The source T-PE or S-PE can then build the next echo reply message with TTL=2 to test the next-next hop for the MS-pseudowire. It will copy the FEC TLV it received in the echo reply message into the new echo request message. The process is terminated when the reply is from the egress T-PE or when a timeout occurs. If specified, the max-ttl parameter in the vccv-trace command will stop on SPE before reaching T-PE.
The results VCCV-trace can be displayed for a fewer number of pseudowire segments of the end-to-end MS-pseudowire path. In this case, the min-ttl and max-ttl parameters are configured accordingly. However, the T-PE/S-PE node will still probe all hops up to min-ttl in order to correctly build the FEC of the desired subset of segments.
Note that this method does not require the use of the downstream mapping TLV in the echo request and echo reply messages.
VCCV for Static Pseudowire Segments
MS pseudowire is supported with a mix of static and signaled pseudowire segments. However, VCCV ping and VCCV-trace is allowed until at least one segment of the MS pseudowire is static. Users cannot test a static segment but also, cannot test contiguous signaled segments of the MS-pseudowire. VCCV ping and VCCV trace is not supported in static-to-dynamic configurations.
Detailed VCCV-Trace Operation
Figure 26 shows how a trace can be performed on the MS-pseudowire originating from T-PE1 by a single operational command. The following process occurs:
- T-PE1 sends a VCCV echo request with TTL set to 1 and a FEC 128 containing the pseudo-wire information of the first segment (pseudowire1 between T-PE1 and S-PE) to S-PE for validation.
- S-PE validates the echo request with the FEC 128. Since it is a switching point between the first and second segment it builds an echo reply with a return code of 8 and includes the FEC 128 of the second segment (pseudowire2 between S-PE and T-PE2) and sends the echo reply back to T-PE1.
- T-PE1 builds a second VCCV echo request based on the FEC128 in the echo reply from the S-PE. It increments the TTL and sends the next echo request out to T-PE2. Note that the VCCV echo request packet is switched at the S-PE datapath and forwarded to the next downstream segment without any involvement from the control plane.
- T-PE2 receives and validates the echo request with the FEC 128 of the pseudowire2 from T-PE1. Since T-PE2 is the destination node or the egress node of the MS-pseudowire it replies to T-PE1 with an echo reply with a return code of 3, (egress router) and no FEC 128 is included.
- T-PE1 receives the echo reply from T-PE2. T-PE1 is made aware that T-PE2 is the destination of the MS pseudowire because the echo reply does not contain the FEC 128 and because its return code is 3. The trace process is completed.
Control Plane Processing of a VCCV Echo Message in a MS-Pseudowire
Sending a VCCV Echo Request
When in the ping mode of operation, the sender of the echo request message requires the FEC of the last segment to the target S-PE/T-PE node. This information can either be configured manually or be obtained by inspecting the corresponding sub-TLV's of the pseudowire switching point TLV. However, the pseudowire switching point TLV is optional and there is no guarantee that all S-PE nodes will populate it with their system address and the pseudowire-id of the last pseudowire segment traversed by the label mapping message. Thus the router implementation will always make use of the user configuration for these parameters.
When in the trace mode operation, the T-PE will automatically learn the target FEC by probing one by one the hops of the MS-pseudowire path. Each S-PE node includes the FEC to the downstream node in the echo reply message in a similar way that LSP trace will have the probed node return the downstream interface and label stack in the echo reply message.
Receiving an VCCV Echo Request
Upon receiving a VCCV echo request the control plane on S-PEs (or the target node of each segment of the MS pseudowire) validates the request and responds to the request with an echo reply consisting of the FEC 128 of the next downstream segment and a return code of 8 (label switched at stack-depth) indicating that it is an S-PE and not the egress router for the MS-pseudowire.
If the node is the T-PE or the egress node of the MS-pseudowire, it responds to the echo request with an echo reply with a return code of 3 (egress router) and no FEC 128 is included.
Receiving an VCCV Echo Reply
The operation to be taken by the node that receives the echo reply in response to its echo request depends on its current mode of operation such as ping or trace.
In ping mode, the node may choose to ignore the target FEC 128 in the echo reply and report only the return code to the operator.
However, in trace mode, the node builds and sends the subsequent VCCV echo request with a incrementing TTL and the information (such as the downstream FEC 128) it received in the echo request to the next downstream pseudowire segment.
IGMP Snooping Diagnostics
MFIB Ping
The multicast forwarding information base (MFIB) ping OAM tool allows to easily verify inside a VPLS which SAPs would normally egress a certain multicast stream. The multicast stream is identified by a source unicast and destination multicast IP address, which are mandatory when issuing an MFIB ping command.
An MFIB ping packet will be sent through the data plane and goes out with the data plane format containing a configurable VC label TTL. This packet traverses each hop using forwarding plane information for next hop, VC label, etc. The VC label is swapped at each service-aware hop, and the VC TTL is decremented. If the VC TTL is decremented to 0, the packet is passed up to the management plane for processing. If the packet reaches an egress node, and would be forwarded out a customer facing port (SAP), it is identified by the OAM label below the VC label and passed to the management plane.
ATM Diagnostics
ATM Diagnostics applies to the 7450 ESS and 7750 SR only.
The ATM OAM ping allows operators to test VC-integrity and endpoint connectivity for existing PVCCs using OAM loopback capabilities.
If portId:vpi/vci PVCC does not exist, a PVCC is administratively disabled, or there is already a ping executing on this PVCC, then this command returns an error.
Because oam atm-ping is a dynamic operation, the configuration is not preserved. The number of oam atm-ping operations that can be performed simultaneously on a 7750 SR or 7450 ESS is configurable as part of the general OAM MIB configuration.
An operator can specify the following options when performing an oam atm-ping:
- end-to-end – this option allows sending oam atm-ping towards the connection endpoint in the line direction by using OAM end-to-end loopback cells
- segment – this option allows sending oam atm-ping towards the segment termination point in the line direction by using OAM segment loopback cells.
The result of ATM ping will show if the ping to a given location was successful. It also shows the round-trip time the ping took to complete (from the time the ping was injected in the ATM SAR device until the time the ping response was given to S/W by the ATM SAR device) and the average ping time for successful attempts up to the given ping response.
An oam atm ping in progress will time-out if a PVCC goes to the operational status down as result of a network failure, an administrative action, or if a PVCC gets deleted. Any subsequent ping attempts will fail until the VC’s operational state changes to up.
To stop a ping in progress, an operator can enter “CTRL – C”. This will stop any outstanding ping requests and will return ping result up to the point of interruption (a ping in progress during the above stop request will fail).
MPLS-TP On-Demand OAM Commands
Ping and Trace tools for PWs and LSPs are supported with both IP encapsulation and the MPLS-TP on demand CV channel for non-IP encapsulation (0x025).
MPLS-TP Pseudowires: VCCV-Ping/VCCV-Trace
The 7450 ESS, 7750 SR, and 7950 XRS routers support VCCV Ping and VCCV Trace on single segment PWs and multi-segment PWs where every segment has static labels and a configured MPLS-TP PW Path ID. It also supports VCCV Ping and Trace on MS-PWs here a static MPLS-TP PW segment is switched to a dynamic T-LDP signaled segment.
Static MS-PW PWs are referred to with the sub-type static in the vccv-ping and vccv-trace command. This indicates to the system that the rest of the command contains parameters that are applied to a static PW with a static PW FEC.
Two ACH channel types are supported: the IPv4 ACH channel type, and the non-IP ACH channel type (0x0025). This is known as the non-ip associated channel. This is the default for type static. The Generic ACH Label (GAL) is not supported for PWs.
If the IPv4 associated channel is specified, then the IPv4 channel type is used (0x0021). In this case, a destination IP address in the 127/8 range is used, while the source address in the UDP/IP packet is set to the system IP address, or may be explicitly configured by the user with the src-ip-address option. This option is only valid if the ipv4 control-channel is specified.
The reply mode is always assumed to be the same application level control channel type for type static.
As with other PW types, the downstream mapping and detailed downstream mapping TLVs (DSMAP/DDMAP TLVs) are not supported on static MPLS-TP PWs.
The follow CLI command description shows the options that are only allowed if the type static option is configured All other options are blocked.
vccv-ping static <sdp-id:vc-id> [target-fec-type pw-id-fec sender-src-address <ip-address> remote-dst-address <ip-address> pw-id <value> pw-type <value>] [dest-global-id <global-id> dest-node-id <node-id>] [assoc-channel ipv4 | non-ip] [fc <fc-name> [profile {in|out}]] [size <octets>] [count <send-count>] [timeout <timeout>] [interval <interval>] [ttl <vc-label-ttl>][src-ip-address <ip-address>]
vccv-trace static <sdp-id:vc-id> [assoc-channel < ipv4 | non-ip] [src-ip-address <ipv4-address>] [target-fec-type pw-id sender-src-address <ip-address> remote-dst-address <ip-address> pw-id <value> pw-type <value> ] [detail] [fc <fc-name> [profile <in|out>]] [interval <interval-value>] [max-fail <no-response-count>] [max-ttl <max-vc-label-ttl>] [min-ttl <min-vc-label-ttl>] [probe-count <probe-count>] [size <octets>] [timeout <timeout-value>]
If the spoke-sdp referred to by sdp-id:vc-id has an MPLS-TP PW-Path-ID defined, then those parameters are used to populate the static PW TLV in the target FEC stack of the vccv-ping or vccv-trace packet. If a Global-ID and Node-ID is specified in the command, then these values are used to populate the destination node TLV in the vccv-ping or vccv-trace packet.
The global-id/node-id are only used as the target node identifiers if the vccv-ping is not end-to-end (i.e. a TTL is specified in the vccv-ping/trace command and it is < 255), otherwise the value in the PW Path ID is used. For vccv-ping, the dest-node-id may be entered as a 4-octet IP address <a.b.c.d> or 32-bit integer <1..4294967295>. For vccv-trace, the destination node-id and global-id are taken form the spoke-sdp context.
The same command syntax is applicable for SAA tests configured under configure saa test a type.
VCCV Ping and VCCV Trace Between Static MPLS-TP and Dynamic PW Segments
The 7450 ESS, 7750 SR, and 7950 XRS routers support end to end VCCV Ping and VCCV trace between a segment with a static MPLS-TP PW and a dynamic T-LDP segment by allowing the user to specify a target FEC type for the VCCV echo request message that is different from the local segment FEC type. That is, it is possible to send a VCCV Ping / Trace echo request containing a static PW FEC in the target stack TLV at a T-PE where the local egress PW segment is signaled, or a VCCV Ping / Trace echo request containing a PW ID FEC (FEC128) in the target stack TLV at a T-PE where the egress PW segment is a static MPLS-TP PW.
Note that all signaled T-LDP segments and the static MPLS-TP segments along the path of the MS-PW must use a common associated channel type. Since only the IPv4 associated channel is supported in common between the two segments, this must be used. If a user selects a non-IP associated channel on the static MPLS-TP spoke-sdp, then vccv-ping and vccv-trace packets will be dropped by the S-PE.
The target-fec-type option of the vccv-ping and vccv-trace command is used to indicate that the remote FEC type is different from the local FEC type. For a vccv-ping initiated from a T-PE with a static PW segment with MPLS-TP parameters, attempting to ping a downstream FEC128 segment, then a target-fec-type of pw-id is configured with a static PW type. In this case, an assoc-channel type of non-ip is blocked, and vice-versa. Likewise the reply-mode must be set to control-channel. For a vccv-ping initiated from a T-PE with a FEC128 PW segment, attempting to ping a downstream static PW FEC segment, a target-fec-type of static is configured with a pw-id PW type, then a control-channel type of non-ip is blocked, and vice-versa. Likewise the reply-mode must also be set to control-channel.
When using VCCV Trace, where the first node to be probed is not the first-hop S-PE. the initial TTL must be set to >1. In this case, the target-fec-type refers to the FEC at the first S-PE that is probed.
The same rules apply to the control-channel type and reply-mode as for the vccv-ping case.
MPLS-TP LSPs: LSP-Ping/LSP Trace
For lsp-ping and lsp-trace commands:
- sub-type static must be specified. This indicates to the system that the rest of the command contains parameters specific to a LSP identified by a static LSP FEC.
- The 7450 ESS, 7750 SR, and 7950 XRS routers support the use of the G-ACh with non-IP encapsulation, IPv4 encapsulation, or labeled encapsulation with IP de-multiplexing for both the echo request and echo reply for LSP-Ping and LSP-Trace on LSPs with a static LSP FEC (such as MPLS-TP LSPs).
- It is possible to specify the target MPLS-TP MEP/MIP identifier information for LSP Ping. If the target global-id and node-id are not included in the lsp-ping command, then these parameters for the target MEP ID are taken from the context of the LSP. The tunnel-number <tunnel-num> and lsp-num <lsp-num> for the far-end MEP are always taken from the context of the path under test.
The following commands are only valid if the sub-type static option is configured, implying that lsp-name refers to an MPLS-TP tunnel LSP:
path-type. Values: active, working, protect. Default: active.
dest-global-id <global-id> dest-node-id <node-id>: Default: the to global-id:node-id from the LSP ID.
assoc-channel: If this is set to none, then IP encapsulation over an LSP is used with a destination address in the 127/8 range. If this is set to ipv4, then IPv4 encapsulation in a G-ACh over an LSP is used with a destination address in the 127/8 range The source address is set to the system IP address, unless the user specifies a source address using the src-ip-address option. If this is set to non-ip, then non-IP encapsulation over a G-ACh with channel type 0x00025 is used. This is the default for sub-type static. Note that the encapsulation used for the echo reply is the same as the encapsulation used for the echo request.
downstream-map-tlv: LSP Trace commands with this option can only be executed if the control-channel is set to none. The DSMAP/DDMAP TLV is only included in the echo request message if the egress interface is either a numbered IP interface, or an unnumbered IP interface. The TLV will not be included if the egress interface is of type unnumbered-mpls-tp.
For lsp-ping, the dest-node-id may be entered as a 4-octet IP address <a.b.c.d> or 32-bit integer <1..4294967295>. For lsp-trace, the destination node-id and global-id are taken form the spoke-sdp context.
The send mode and reply mode are always taken to be an application level control channel for MPLS-TP.
The force parameter causes an LSP ping echo request to be sent on an LSP that has been brought oper-down by BFD (LSP-Ping echo requests would normally be dropped on oper-down LSPs). This parameter is not applicable to SAA.
The LSP ID used in the LSP Ping packet is derived from a context lookup based on lsp-name and path-type (active/working/protect).
Dest-global-id and dest-node-id refer to the target global/node id. They do not need to be entered for end-to-end ping and trace, and the system will use the destination global id and node id from the LSP ID.
The same command syntax is applicable for SAA tests configured under configure>saa>test.
VxLAN Ping Supporting EVPN for VxLAN
EVPN is an IETF technology per RFC7432 that uses a new BGP address family and allows VPLS services to be operated as IP-VPNs, where the MAC addresses and the information to setup the flooding trees are distributed by BGP. The EVPN VxLAN connections, VxLAN Tunnel Endpoint (VTEP), uses a connection specific OAM Protocol for on demand connectivity verification. This connection specific OAM tool, VxLAN Ping, is described in the Layer 2 Services Guide, within the VxLAN Section.
Show Commands
The sample outputs in the following section are examples only; actual displays may differ depending on supported functionality and user configuration.
BFD
The existing show>router>bfd context should be enhanced for MPLS-TP, as follows:
show>router>bfd>mpls-tp-lsp
Displays the MPLS –TP paths for which BFD is enabled.
show>router>bfd>session [src <ip-address> [dest <ip-address> | detail]]|[mpls-tp-path <lsp-id…> [detail]]
Should be enhanced to show the details of the BFD session on a particular MPLS-TP path, where lsp-id is the fully qualified lsp-id to which the BFD session is in associated.
A sample output is shown below:
IP Performance Monitoring (IP PM)
The SR OS supports Two-Way Active Measurement Protocol (TWAMP) and Two-Way active Measurement Protocol Light (TWAMP Light).
This section describes the following topics:
Two-Way Active Measurement Protocol (TWAMP)
Two-Way Active Measurement Protocol (TWAMP) provides a standards-based method for measuring the IP performance (packet loss, delay, and jitter) between two devices. TWAMP leverages the methodology and architecture of One-Way Active Measurement Protocol (OWAMP) to define a way to measure two-way or round-trip metrics.
There are four logical entities in TWAMP: the control-client, the session-sender, the server, and the session-reflector. The control-client and session-sender are typically implemented in one physical device (the “client”) and the server and session-reflector in a second physical device (the “server”). The router acts as the “server”.
The control-client and server establish a TCP connection and exchange TWAMP-Control messages over this connection. When a server accepts the TCP control session from the control-client, it responds with a server greeting message. This greeting includes the various modes supported by the server. The modes are a bit mask. Each bit in the mask represents a functionality supported on the server. When the control-client wants to start testing, the client communicates the test parameters to the server, requesting any of the modes that the server supports. If the server agrees to conduct the described tests, the test begin as soon as the client sends a Start-Sessions message. As part of a test, the session-sender sends a stream of UDP-based test packets to the session-reflector, and the session-reflector responds to each received packet with a response UDP-based test packet. When the session-sender receives the response packets from the session-reflector, the information is used to calculate two-way delay, packet loss, and packet delay variation between the two devices. The exchange of test PDUs is referred to as TWAMP Test.
The TWAMP test PDU does not achieve symmetrical packet size in both directions unless the frame is padded by a minimum of 27 bytes. The session-sender is responsible for applying the desired padding. The session-reflector will take appropriate action on the padding based on the selected mode of operation.
Two-Way Active Measurement Protocol Light (TWAMP Light)
TWAMP Light is an optional model included in the TWAMP standard RFC5357 that uses standard TWAMP test packets but provides a lightweight approach to gathering ongoing IP delay and synthetic loss performance data for base router and per VPRN statistics. Full details are described in Appendix I of RFC 5357 (Active Two Way Measurement Protocol). The SR OS implementation supports the TWAMP Light model for gathering delay and loss statistics.
For TWAMP Light, the complete TWAMP model is replaced with a simple session-sender session-reflector.
TWAMP Light maintains the TWAMP test packet exchange but eliminates the TWAMP TCP control connection with local configurations; however, not all negotiated control parameters are replaced with local configuration. For example, CoS parameters communicated over the TWAMP control channel are replaced with a reply-in-kind approach. The reply-in-kind model reflects back the received CoS parameters, which are influenced by the reflector’s QoS policies.
The reflector function is configured under the config>router>twamp-light command hierarchy for base router reflection, and under the config>service>vprn>twamp-light command hierarchy for per VPRN reflection. The TWAMP Light reflector function is configured per context and must be activated before reflection can occur; the function is not enabled by default for any context. The reflector requires the operator to define the TWAMP Light UDP listening port that identifies the TWAMP Light protocol and the prefixes that the reflector will accept as valid sources for a TWAMP Light request. Prior to release 13.0r4, if the configured TWAMP Light reflector UDP listening port was in use by another application on the system, a minor OAM message was presented indicating the UDP port was unavailable and that activation of the reflector is not allowed.
Notes: The TWAMP Light Reflector udp-port udp-port-number range configured as part of the config>service|router>twamp-light create command implements a restricted reserved UDP port range that must be adhere to range [64364..64373] prior to an upgrade or reboot. Configurations outside of this range will result in a failure of the TWAMP Light reflector or the prevention of the upgrade operation. If an In Service Software Upgrade (ISSU) function is invoked and the udp-port udp-port-number range is outside of the allowable range and the TWAMP Light Reflector is in a no shutdown state, the ISSU operation will not be allowed to proceed until, at a minimum, the TWAMP Light Reflector is shutdown. If the TWAMP Light Reflector is shutdown, the ISSU will be allowed to proceed, but the TWAMP Light Reflector will not be allowed to activate with a no shutdown until the range is brought in line the allowable range. A non-ISSU upgrade will be allowed to proceed regardless of the state (shutdown or no shutdown) of the TWAMP Light Reflector. The configuration will be allowed to load, but the TWAMP Light Reflector will remain inactive following the reload when the range is outside the allowable range. When the udp-port udp-port-number for a TWAMP Light Reflector is modified, all tests that were using the services of that reflector must update the dest-udp-port udp-port-number configuration parameter to match the new reflector listening port.
If the source IP address in the TWAMP Light packet arriving on the responder does not match a configured IP address prefix, the packet is dropped. Multiple prefix entries may be configured per context on the responder. Configured prefixes can be modified without shutting down the reflector function. An inactivity timeout under the config>oam-test>twamp>twamp-light command hierarchy defines the amount of time the reflector will keep the individual reflector sessions active in the absence of test packets. A responder requires CPM3 and beyond hardware.
Launching TWAMP Light test packets is under the control of the OAM Performance Monitoring (OAM-PM) architecture and as such adheres to those rules. This functionality is not available through interactive CLI or interactive SNMP, it is only available under the OAM-PM configuration construct. OAM-PM will report TWAMP Light delay and loss metrics. The OAM-PM architecture includes the assignment of a Test-ID. This protocol does not carry the 4-byte test ID in the packet. This is for local significance and uniformity with other protocols under the control of the OAM-PM architecture. The OAM-PM construct allows various test parameters to be defined. These test parameters include the IP session-specific information which allocates the test to the specific routing instance, the source and destination IP address, the destination UDP port (which must match the UDP listening port on the reflector), the source UDP port and a number of other parameters that allow the operator to influence the packet handling. The source UDP port should only be configured when TWAMP distributed mode is being deployed. The probe interval and TWAMP Light packet padding size can be configured under the specific session. The pad size, the size of the all 0's pad, can configured to ensure that the TWAMP packet is the same size in both directions. The session-sender role facilitated by the OAM-PM TWAMP Light testing will only set the multiplier bits in the Error Estimate field contained in the TWAMP test packet. The 8-bit multiplier field will be set to 00000001. The preceding 8 bits of the Error Estimate field comprised of S (1 bit - Time Sync), Z (1 bit MBZ) and Scale (6 bits) will all be set to 0.
TWAMP Test uses a single packet to gather both delay and loss metrics. This means there is special consideration over those approaches that utilize a specific tool per metric type.
In the TWAMP-Light case the interval parameter, which defines the probe spacing, is a common option applicable to all metrics collected under a single session. This requires the parameter to be removed from any test specific configurations, like the timing parameter associated with loss, specifically availability. Packet processing marks all fields in the PDU to report both delay and loss. The record-stats option can be used to refine which fields to process as part of the OAM-PM architecture. The default collection routine includes delay field processing only, record-stats delay. This is to ensure backward compatibility with previous releases that only supported the processing delay fields in the PDU. Enabling the processing of loss information requires the modification of the record-stats parameter. Adding loss to an active test requires the active test to be shutdown, modified and activate with the no shutdown command. It is critical to remember that the no shutdown action clears all previously allocated system memory for every test. Any results not written to flash or collected through SNMP are lost.
The record-stats setting do not change the configuration validation logic when a test is activated with the no shutdown command. Even if the loss metrics are not being processed and reported the configuration logic must ensure that the TWAMP test parameters are within the acceptable configuration limits, this includes default loss configuration statements. An operator has the ability to configure a TWAMP Light interval of 10s (10000ms) and record only delay statistics. The default timing parameter, used to compute and report availability and reliability, should allow for the activation of the test without a configuration violation. This requires the frame-per-delta-t frames default value of 1. An availability window cannot exceed 100s regardless of the record-stats setting. Computing the size of the availability window is a product of (interval*frames-per-delta-t*consec-delta-t).
The statistics display for the session with show all statistics that are being collected based on the record-stats configuration. If either of the metrics is not being recorded the statistics will display NONE for the excluded metrics.
Multiple tests sessions between peers are allowed. These test sessions are unique entities and may have different properties. Each test will generate TWAMP packets specific to their configuration.
TWAMP Light is supported on deployments that use IPv4 or IPv6 addressing, which may each have their own hardware requirements. All IP addressing must be unicast. IPv6 addresses can not be a reserved or a link local address. Multiple test sessions may be configured between the same source and destination IP endpoints. The tuple Source IP, Destination IP, Source UDP, and Destination UDP provide a unique index for each test point.
The OAM-PM architecture does not validate any of the TWAMP Light test session information. A test session will be allowed to be activated regardless of the validity of session information. For example, if the source IP address configured is not local within the router instance that the test is allocated, the session controller will start sending TWAMP Light test packets but will not receive any responses.
See the OAM-PM section of this guide for more information about the integration of TWAMP Light and the OAM-PM architecture, including hardware dependencies.
The example below shows a basic configuration using TWAMP Light to monitor two IP endpoints in a VPRN, including the default TWAMP Light values that were not overridden with configuration entries.
The following examples shows a reflector configuration:
The following example shows a session controller configuration:
Ethernet Connectivity Fault Management (ETH-CFM)
The IEEE and the ITU-T have cooperated to define the protocols, procedures and managed objects to support service based fault management. Both IEEE 802.1ag standard and the ITU-T Y.1731 recommendation support a common set of tools that allow operators to deploy the necessary administrative constructs, management entities and functionality, Ethernet Connectivity Fault Management (ETH-CFM). The ITU-T has also implemented a set of advanced ETH-CFM and performance management functions and features that build on the proactive and on demand troubleshooting tools.
CFM uses Ethernet frames and is distinguishable by ether-type 0x8902. In certain cases the different functions will use a reserved multicast address that could also be used to identify specific functions at the MAC layer. However, the multicast MAC addressing is not used for every function or in every case. The Operational Code (OpCode) in the common CFM header is used to identify the type of function carried in the CFM packet. CFM frames are only processed by IEEE MAC bridges. With CFM, interoperability can be achieved between different vendor equipment in the service provider network up to and including customer premises bridges. The following table lists CFM-related acronyms used in this section.
IEEE 802.1ag and ITU-T Y.1731 functions that are implemented are available on the SR and ESS platforms.
This section of the guide will provide configuration example for each of the functions. It will also provide the various OAM command line options and show commands to operate the network. The individual service guides will provide the complete CLI configuration and description of the commands in order to build the necessary constructs and management points.
Acronym | Callout | Supported platform |
1DM | One way Delay Measurement (Y.1731) | All |
AIS | Alarm Indication Signal | All |
CCM | Continuity check message | All |
CFM | Connectivity fault management | All |
CSF | Client Signal Fail (Receive) | All |
DMM | Delay Measurement Message (Y.1731) | All |
DMR | Delay Measurement Reply (Y.1731) | All |
LBM | Loopback message | All |
LBR | Loopback reply | All |
LMM | (Frame) Loss Measurement Message | Platform specific |
LMR | (Frame) Loss Measurement Response | Platform specific |
LTM | Linktrace message | All |
LTR | Linktrace reply | All |
ME | Maintenance entity | All |
MA | Maintenance association | All |
MA-ID | Maintenance association identifier | All |
MD | Maintenance domain | All |
MEP | Maintenance association end point | All |
MEP-ID | Maintenance association end point identifier | All |
MHF | MIP half function | All |
MIP | Maintenance domain intermediate point | All |
OpCode | Operational Code | All |
RDI | Remote Defect Indication | All |
TST | Ethernet Test (Y.1731) | All |
SLM | Synthetic Loss Message | All |
SLR | Synthetic Loss Reply (Y.1731) | All |
This section describes the following topics:
ETH-CFM Building Blocks
The IEEE and the ITU-T use their own nomenclature when describing administrative contexts and functions. This introduces a level of complexity to configuration, discussion and different vendors naming conventions. The SR OS CLI has chosen to standardize on the IEEE 802.1ag naming where overlap exists. ITU-T naming is used when no equivalent is available in the IEEE standard. In the following definitions, both the IEEE name and ITU-T names are provided for completeness, using the format IEEE Name/ITU-T Name.
Maintenance Domain (MD)/Maintenance Entity (ME) is the administrative container that defines the scope, reach and boundary for faults. It is typically the area of ownership and management responsibility. The IEEE allows for various formats to name the domain, allowing up to 45 characters, depending on the format selected. ITU-T supports only a format of “none” and does not accept the IEEE naming conventions.
- 0 — Undefined and reserved by the IEEE.
- 1 — No domain name. It is the only format supported by Y.1731 as the ITU-T specification does not use the domain name. This is supported in the IEEE 802.1ag standard but not in currently implemented for 802.1ag defined contexts.
- 2,3,4 — Provides the ability to input various different textual formats, up to 45 characters. The string format (2) is the default and therefore the keyword is not shown when looking at the configuration.
Maintenance Association (MA)/Maintenance Entity Group (MEG) is the construct where the different management entities will be contained. Each MA is uniquely identified by its MA-ID. The MA-ID is comprised of the by the MD level and MA name and associated format. This is another administrative context where the linkage is made between the domain and the service using the bridging-identifier configuration option. The IEEE and the ITU-T use their own specific formats. The MA short name formats (0-255) have been divided between the IEEE (0-31, 64-255) and the ITU-T (32-63), with five currently defined (1-4, 32). Even though the different standards bodies do not have specific support for the others formats a Y.1731 context can be configured using the IEEE format options.
- 1 (Primary VID) — Values 0 — 4094
- 2 (String) — Raw ASCII, excluding 0-31 decimal/0-1F hex (which are control characters) form the ASCII table
- 3 (2-octet integer) — 0 — 65535
- 4 (VPN ID) — Hex value as described in RFC 2685, Virtual Private Networks Identifier
- 32 (icc-format) — Exactly 13 characters from the ITU-T recommendation T.50.
| Note:
When a VID is used as the short MA name, 802.1ag will not support VLAN translation because the MA-ID must match all the MEPs. The default format for a short MA name is an integer. Integer value 0 means the MA is not attached to a VID. This is useful for VPLS services on SR OS platforms because the VID is locally significant. |
Maintenance Domain Level (MD Level)/Maintenance Entity Group Level (MEG Level) is the numerical value (0-7) representing the width of the domain. The wider the domain, higher the numerical value, the farther the ETH-CFM packets can travel. It is important to understand that the level establishes the processing boundary for the packets. Strict rules control the flow of ETH-CFM packets and are used to ensure proper handling, forwarding, processing and dropping of these packets. To keep it simple ETH-CFM packets with higher numerical level values will flow through MEPs on MIPs on SAPs configured with lower level values. This allows the operator to implement different areas of responsibility and nest domains within each other. Maintenance association (MA) includes a set of MEPs, each configured with the same MA-ID and MD level used verify the integrity of a single service instance.
In the following example, a Y.1731 domain context and 802.1ag context are configured. The Y.1731 context can be identified by the none setting for the domain format.
The chassis does not support a domain format of none for the 802.1ag contexts. The domain index, the first numerical value, is not related to the level, even though in this example they do match.
The following example illustrates the creation of the association within the domain context. The association links the construct to the service using the value of the bridge-identifier. The value specified for the bridge-identifier is equivalent to the numerical value used to create the service.
This example show how to format the association within the domain to match the domain format, Y.1731 (domain 3/association 1) or 802.1ag (domain 4/association 1), and how the 802.1ag association format can be configured within a Y.1731 domain (domain 3/association 2). The mixed configuration represented by domain 3 association 2 may be of value in mixed Y.1731 and 802.1ag environments.
The CCM-interval is also specified within the association and has a default of 10 seconds unless specifically configured with another value. When the association is created and the MEP is a facility MEP the bridge-identifier is not to be included in the configuration since the facility MEP is not bound to a service. Facility MEPs are described in the Services Overview Guide.
Maintenance Endpoints/MEG Endpoints (MEP) are the workhorses of ETH-CFM. A MEP is the unique identification within the association (1-8191). Each MEP is uniquely identified by the MA-ID, MEPID tuple. This management entity is responsible for initiating, processing and terminating ETH-CFM functions, following the nesting rules. MEPs form the boundaries which prevent the ETH-CFM packets from flowing beyond the specific scope of responsibility. A MEP has direction, up or down. Each indicates the directions packets will be generated; up toward the switch fabric, down toward the SAP away from the fabric. Each MEP has an active and passive side. Packets that enter the active point of the MEP will be compared to the existing level and processed accordingly. Packets that enter the passive side of the MEP are passed transparently through the MEP. Each MEP contained within the same maintenance association and with the same level (MA-ID) represents points within a single service. MEP creation on a SAP is allowed only for Ethernet ports with NULL, q-tags, q-in-q encapsulations. MEPs may also be created on SDP bindings. A vMEP is a service level MEP configuration that installs ingress (down MEP-like) extraction on the supported ETH-CFM termination points within a VPLS configuration.
Maintenance Intermediate Points/MEG Intermediate Points (MIPs) are management entities between the terminating MEPs along the service path. MIPs provide insight into the service path connecting the MEPs. MIPs only respond to Loopback Messages (LBM) and Linktrace Messages (LTM). All other CFM functions are transparent to these entities.
MIP creation is the result of the mhf-creation mode and interaction with related MEPs, and with the direction of the MEP. Two different authorities can be used to determine the MIPs that should be considered and instantiated. The domain and association or the default-domain hierarchies match the configured bridge identifier and VLAN to the service ID and any configured primary VLAN. When a primary VLAN MIP is not configured, the VLAN is either ignored or configured as none. The mhf-creation command is described in the Services Overview Guide.
The domain and association MIP creation function triggers a search for all ETH-CFM domain association bridge identifier matches to the service ID. A MIP candidate is then be evaluated using the mhf-creation mode and the rules that govern the algorithm. The domain association mhf-creation modes and their uses are listed below:
- none: a MIP is not a candidate for creation using this domain association bridge identifier. This is the default mhf-creation mode for every bridge identifier under this hierarchy.
- explicit: a MIP is a candidate for creation using this domain association bridge identifier only if a lower-level MEP exists.
- default: a MIP is a candidate for creation using this domain association bridge identifier regardless of the existence of a lower-level MEP. If a lower-level MEP is present, this creation mode behaves in the same manner as explicit creation mode.
- static: a MIP is a candidate for creation using the domain association bridge identifier at the level of the domain. This creation mode is specific to MIPs with the primary-vlan-enabled parameter configured. Different VLANs maintain their own level hierarchies. Primary VLAN creation under this context requires static mode.
For all modes except static mode, only a single MIP can be created. All candidates are collected and the lowest-level valid MIP is created. In static mode, all valid MIPs will be created for the bridge identifier VLAN pair. A MIP is considered invalid if the level of the MIP is equal to or below a downward-facing MEP, or below the level of an upward-facing MEP and the MIP shares the same service component as the Up MEP.
Not all creation modes require the mip creation statement within the service. The explicit and default mhf-creation modes may instantiate a MIP without the mip creation statement under the service if a lower-level MEP exists for the domain association bridge identifier. If a lower-level MEP does not exist, the default and static mhf-creation modes require the mip creation statement on the service connection.
MEPs require the domain and association configurations to ensure that all ETH-CFM PDUs can be supported. MIPs have restricted ETH-CFM PDU support: ETH-LB and ETH-LT. These two protocols do not require the configuration of a domain and association. MIPs may be created outside of the association context using the default-domain table.
The default-domain table is an object table populated with values that are used for MIP creation. The table is indexed by the bridge identifier and VLAN. An index entry is automatically added when the mip creation statement is added under a SAP or SDP binding. When an index entry is added, the bridge identifier is set to the service ID and the VLAN is set to the primary-vlan-enable vlan-id. If the MIP does not use primary VLAN functionality, the VLAN will be configured as none. When the entry has been added to the default-domain table, the default values can be configured. The default-domain table defers to the system-wide, read-only values.
Because there are two different locations able to process the MIP creation logic, a per-bridge identifier VLAN authority must be determined. The authority is a component, table, or configuration that is responsible for executing the MIP creation algorithm. In general, any domain association bridge identifier that could be used to create a specific MIP is authoritative. Other configurations influence the authority, such as the type of MIP (primary VLAN or non-primary VLAN), the different mhf-creation modes, the interaction of those modes with MEPs, and the direction of the MEP.
The following rules provide some high-level guidelines to determine the authority.
- Rule 1: The original model predating the default-domain is always applied first. If a MIP is created using the original model, the new model will not be applied. The original model includes complex Up MEP MIP creation rules. If an Up MEP exists on a service connection, any service connection other than the one with the active Up MEP will attempt to create the lowest higher-level MIP using the domain association bridge identifier table. If a higher-level MIP cannot be created, and no higher-level association exists, the default-domain table is consulted.
- Rule 2: A mip creation statement is required under the service connection in order to use the default-domain table. This is different from the domain association table. The domain association table does not require the mip creation statement when the mhf-creation mode is configured as either explicit or default and a lower-level MEP is present.
- Rule 3: If no domain association bridge identifier matches the service ID, the default-domain table is consulted.
- Rule 4: If a domain association bridge identifier matches a service ID for the sole purpose of MEP creation, and no higher or lower domain association with the same bridge identifier exists, the default-domain table is consulted.
- Rule 4a: Any domain association bridge identifier matching a service ID with a configured VLAN and a static mhf-creation mode is authoritative for all matching service IDs and MIPs with primary-vlan-enable configured with the same VLAN.
- Rule 4b: Any domain association bridge identifier attempting to create a MIP with primary-vlan-enable configured is considered non-authoritative if the mhf-creation mode is anything other than static.
When the authority for MIP creation is determined, the MIP attributes are derived from that creation table. The default-domain table defers to the read-only, system-wide MIP values and inherits those defaults. Some of the objects under the default-domain hierarchy must be configured using the same statement to avoid transient and unexpected MIP creation while the configuration is being completed. To this end, the mhf-creation mode and level have been combined in the same configuration statement.
The standard mhf-creation modes (none, default, explicit) are configurable as part of the default-domain table. Static mode can only be configured under the domain association bridge identifier. This is because default-domain table indexing precludes multiple MIPs at different levels.
MIP creation requires configuration. The default values in both the domain association and the default-domain table prevent MIP instantiation.
The show eth-cfm mip-instantiation command can be used to check the authority for each MIP.
There are two locations in the configuration where ETH-CFM is defined. The domains, associations (including links to the service ID), MIP creation method, common ETH-CFM functions, and remote MEPs are defined under the top-level eth-cfm command. If Y.1731 functions are required, the context under which the MEPs are configured should follow the Y.1731 specific formats (domain format of none). The Y.1731 functions (ais-enable, eth-test-enable, and csf-enable) are rejected under a non-Y.1731 MEP. The Y.1731 specific on-demand tests are blocked from the global CLI. The Y.1731 PM tests are not blocked when executed against a non-Y.1731 domain format when launched from OAM-PM and SAA. When these parameters have been entered, the MEP, and possibly the MIP, can be defined within the service under the SAP or SDP binding.
Table 5 is a general table that indicates ETH-CFM support for the different services and SAP or SDP binding. It is not meant to indicate the services that are supported or the requirements for those services on the individual platforms.
Table 5: ETH-CFM Support Matrix
Service | Ethernet Connection | Down MEP | Up MEP | MIP | Virtual MEP |
Epipe | — | — | — | — | No |
SAP | Yes | Yes | Yes | — | |
Spoke-SDP | Yes | Yes | Yes | — | |
VPLS | — | — | — | — | Yes |
SAP | Yes | Yes | Yes | — | |
Spoke-SDP | Yes | Yes | Yes | — | |
Mesh-SDP | Yes | Yes | Yes | — | |
B-VPLS | — | — | — | — | Yes |
SAP | Yes | Yes | Yes | — | |
Spoke-SDP | Yes | Yes | Yes | — | |
Mesh-SDP | Yes | Yes | Yes | — | |
I-VPLS | — | — | — | — | No |
SAP | Yes | Yes | Yes | — | |
Spoke-SDP | Yes | Yes | Yes | — | |
M-VPLS | — | — | — | — | No |
SAP | Yes | Yes | Yes | — | |
Spoke-SDP | Yes | Yes | Yes | — | |
Mesh-SDP | Yes | Yes | Yes | — | |
PBB EPIPE | — | — | — | — | No |
SAP | Yes | Yes | Yes | — | |
Spoke-SDP | Yes | Yes | Yes | — | |
IPIPE | — | — | — | — | No |
SAP | Yes | No | No | — | |
Ethernet-Tunnel SAP | Yes | No | No | — | |
IES | — | — | — | — | No |
SAP | Yes | No | No | — | |
Spoke-SDP (Interface) | Yes | No | No | — | |
Subscriber Group-int SAP | Yes | No | No | — | |
VPRN | — | — | — | — | No |
SAP | Yes | No | No | — | |
Spoke-SDP (Interface) | Yes | No | No | — | |
Subscriber Group-int SAP | Yes | No | No | — |
Figure 27: MEP and MIP
Figure 28 illustrates the usage of an EPIPE on two different nodes that are connected using ether SAP 1/1/2:100.31. The SAP 1/1/10:100.31 is an access port that is not used to connect the two nodes.
Figure 28: MEP Creation
Examining the configuration from NODE1, MEP 101 is configured with a direction of UP causing all ETH-CFM traffic originating from this MEP to generate into the switch fabric and out the mate SAP 1/1/2:100.31. MEP 111 uses the default direction of DOWN causing all ETH-CFM traffic that is generated from this MEP to send away from the fabric and only egress the SAP on which it is configured, SAP 1/1/2:100.31.
Further examination of the domain constructs reveal that the configuration properly uses domain nesting rules. In this case, the Level 3 domain is completely contained in a Level 4 domain.
Figure 29 illustrates the creation of and explicit MIP.
Figure 29: MIP Creation Example (NODE1)
An addition of association 2 under domain four includes the mhf-creation explicit statement. This means that when the level 3 MEP is assigned to the SAP 1/1/2:100.31 using the definition in domain 3 association 1, creating the higher level MIP on the same SAP. Since a MIP does not have directionality “Both” sides are active. The service configuration and MEP configuration within the service did not change.
Figure 30 illustrates a simpler method that does not require the creation of the lower level MEP. The operator simply defines the association parameters and uses the mhf-creation default setting, then places the MIP on the SAP of their choice.
Figure 30: MIP Creation Default
NODE1:
NODE2:
Figure 31 shows the detailed IEEE representation of MEPs, MIPs, levels and associations, using the standards defined icons.
SAPs support a comprehensive set of rules including wild cards to map packets to services. For example, a SAP mapping packets to a service with a port encapsulation of QinQ may choose to only look at the outer VLAN and wildcard the inner VLAN. SAP 1/1/1:100.* would map all packets arriving on port 1/1/1 with an outer VLAN 100 and any inner VLAN to the service the SAP belongs to. These powerful abstractions will extract inbound ETH-CFM PDUs only when there is an exact match to the SAP construct. In the case of the example when then an ETH-CFM PDU arrives on port 1/1/1 with a single VLAN with a value of 100 followed immediately with e-type (0x8902 ETH-CFM). Furthermore, the generation of the ETH-CFM PDUs that egress this specific SAP will be sent with only a single tag of 100. If the operator needs to extract ETH-CFM PDUs or generate ETH-CFM PDUs on wildcard SAPs Primary VLAN will be required.
Table 6 shows how packets that would normally bypass the ETH-CFM extraction would be extracted when Primary VLAN is configured. This assumes that the processing rules for MEPs and MIPs is met, E-type 0x8902, Levels and OpCodes.
Table 6: Extraction Comparison with Primary VLAN
Port Encapsulation | E-type | Ingress Tag(s) | Ingress SAP | No Primary VLAN ETH-CFM Extraction | With Primary VLAN (10) ETH-CFM Extraction | ||
— | — | — | — | MEP | MIP | MEP | MIP |
Dot1q | 0x8902 | 10 | x/y/z:* | No | No | Yes | Yes |
Dot1q | 0x8902 | 10.10 | x/y/z:10 | No | No | Yes | Yes |
QinQ | 0x8902 | 10.10 | x/y/z:10.* | No | No | Yes | Yes |
QinQ (Default Behavior) | 0x8902 | 10.10 | x/y/z:10.0 | No | No | Yes | Yes |
Null | 0x8902 | 10 | x/y/z | No | No | Yes | Yes |
The mapping of the service data remains unchanged. The Primary VLAN function allows for one additional VLAN offset beyond the SAP configuration, up to a maximum of two VLANs in the frame. If a fully qualified SAP specifies two VLANs (SAP 1/1/1:10.10) and a primary VLAN of 12 is configured for the MEP there will be no extraction of ETH-CFM for packets arriving tagged 10.10.12. That exceeds the maximum of two tags.
The mapping or service data based on SAPs has not changed. ETH-CFM MPs functionality remains SAP specific. In instances where as service includes a specific SAP with a specified VLAN (1/1/1:50) and a wildcard SAP on the same port (1/1/1:*) it is important to understand how the ETH-CFM packets are handled. Any ETH-CFM packet with etype 0x8902 arriving with a single tag or 50 would be mapped to a classic MEP configured under SAP 1/1/1:50. Any packet arriving with an outer VLAN of 50 and second VLAN of 10 would be extracted by the 1/1/1:50 SAP and would require a Primary VLAN enabled MEP with a value of 10, assuming the operator would like to extract the ETH-CFM PDU of course. An inbound packet on 1/1/1 with an outer VLAN tag of 10 would be mapped to the SAP 1/1/1:*. If ETH-CFM extraction is required under SAP 1/1/1:* a Primary VLAN enabled MEP with a value of 10 would be required.
Obviously, the packet that is generated from a MEP or MIP with Primary VLAN enabled will include that VLAN. The SAP will encapsulate the Primary VLAN using the SAP encapsulation.
Primary VLAN support includes UP MEPs, DOWN MEPs and MIPs on Ethernet SAPs, including LAG for ePipe and VPLS services. There is no support for Primary VLAN configuration for vMEPs or MEPs on SDP binding. Classic MEPs, those without a primary VLAN enabled, and Primary VLAN enabled MEPs can co-exist under the same SAP. Classic MIPs and Primary VLAN enabled MIPs may also coexist. The enforcement of a single classic MIP per SAP continues to be enforced. However, the operator may configure multiple Primary VLAN enabled MIPs on the same SAP. MIPs in the Primary VLAN space must include the mhf-creation static under the association and must also include the specific VLAN on the MIP creation statement under the SAP. The no version of the mip command must include the entire statement including the VLAN information.
The eight MD Levels (0-7) are specific to context in which the Management Point (MP) is configured. This means the classic MPs have a discrete set of the levels from the Primary VLAN enabled space. Each Primary VLAN space has its own eight Level MD space for the specified Primary VLAN. Consideration must be given before allowing overlapping levels between customers and operators should the operator be provision a customer facing MP, like a MIP on a UNI. CPU Protection extensions for ETH-CFM are VLAN unaware and based on MD Level and the OpCode. Any configured rates will be applied to the Level and OpCode as a group.
There are two configuration steps to enable Primary VLAN. Under the bridging instance, contained within the association context (cfg>eth-cfm>domain>assoc>bridge) the VLAN information must be configured. Until this is enabled using the primary-vlan-enable option as part of the MEP creation step or the MIP statement (cfg>service>…>sap>eth-cfm>) the VLAN specified under the bridging instance remains inactive. This is to ensure backward interoperability.
Primary VLAN functions require a minimum of IOM3/IMM. There is no support for vpls-sap-templates. Sub second CCM intervals are not supported for Primary VLAN MEPs.
Figure 31: MEP, MIP and MD Levels
An operator may see the following INFO message (during configuration reload), or MINOR (error) message (during configuration creation) when upgrading to 11.0r4 or later if two MEPs are in a previously undetected conflicting configuration. The messaging is an indication that a MEP, the one stated in the message using format (domain <md-index> / association <ma-index> / mep <mep-id>), is already configured and has allocated that context. During a reload (INFO) a MEP that encounters this condition will be created but its state machine will be disabled. If the MINOR error occurs during a configuration creation this MEP will fail the creation step. The indicated MEP will need to be correctly re-configured.
Loopback
A loopback message is generated by an MEP to its peer MEP or a MIP (Figure 32). The functions are similar to an IP ping to verify Ethernet connectivity between the nodes.
Figure 32: CFM Loopback
The following loopback-related functions are supported:
- Loopback message functionality on an MEP or MIP can be enabled or disabled
- MEP — Supports generating loopback messages and responding to loopback messages with loopback reply messages. The ETH-LB PDU format does not allow a MEP to have more than a single active ETH-LB session.
- MIP — Supports responding to loopback messages with loopback reply messages when loopback messages are targeted to self
- SenderID TLV may optionally be configured to carry the ChassisID. When configured, this information will be included in LBM messages.
- Only the ChassisID portion of the TLV will be included
- The Management Domain and Management Address fields are not supported on transmission
- As per the specification, the LBR function copies and returns any TLVs received in the LBM message. This means that the LBR message will include the original SenderID TLV.
- Supported for both service (id-permission) and facility MEPs (facility-id-permission)
- Supported for both MEP and MIP
- Displays the loopback test results on the originating MEP
The ETH-LBM (loopback) function includes parameters for sub second intervals, timeouts, and new padding parameters. The CLI display output has been enhanced to provide more information and a new format.
When an ETH-LBM command is issued using a sub second interval (100ms), the output success will be represented with a “!” character, and a failure will be represented with a “.” The updating of the display will wait for the completion of the previous request before producing the next result. However, the packets will maintain the transmission spacing based on the interval option specified in the command.
When the interval is one seconds or higher, the output will provide detailed information that includes the number of bytes (from the LBR), the source MEP ID (format md-index/ma-index/mepid), and the sequence number as it relates to this test and the result.
Since ETH-LB does not support standard timestamps, no indication of delay is produced as these times are not representative of network delay.
By default, if no interval is included in the command, the default is back to back LBM transmissions. The maximum count for such a test is 5.
Loopback Multicast
Multicast loopback also support the new intervals. However, the operator must be careful when using this approach. Every MEP in the association will respond to this request. This means an exponential impact on system resources for large scale tests. If the multicast option is used and there with an interval of 1 (100ms) and there are 50 MEPs in the association, this will result in a 50 times increase in the receive rate (500pps) compared to a unicast approach. Multicast displays will not be updated until the test is completed. There is no packet loss percentage calculated for multicast loopback commands.
This on demand operation tool is used to quickly check the reachability of all MEPs within an Association. A multicast address can be coded as the destination of an oam eth-cm loopback command. The specific class 1 multicast MAC address or the keyword “multicast” can be used as the destination for the loopback command. The class 1 ETH-CFM multicast address is in the format 01:80:C2:00:00:3x (where x = 0 - 7 and is the number of the domain level for the source MEP). When the “multicast” option is used, the class 1 multicast destination is built according to the local MEP level initiating the test.
Remote MEPs that receive this message, configured at the equivalent level, will terminate and process the multicast loopback message responding with the appropriate unicast loopback response (ETH-LBR). Regardless of whether a multicast or unicast ETH-LBM is used, there is no provision in the standard LBR PDU to carry the MEP-ID of the responder. This means only the remote MEP MAC Address will be reported and subsequently displayed. MIPs will not respond to the multicast ETH-LBM. It is important to understand that although MIPs do not respond they perform the basic level and opcode check to determine whether they need to decode the packet. MIPs along the applicable path over which the LBM is sent that match the level and opcode will decode the packet, not respond and forward along the path.
MEP loopback stats are not updated as a result of this test being run. That means the received, out-of-order and bad-msdu counts are not affected by multicast loopback tests. The multicast loopback command is meant to provide immediate connectivity troubleshooting feedback for remote MEP reachability only.
Linktrace
A linktrace message is originated by an MEP and targeted to a peer MEP in the same MA and within the same MD level (Figure 33). Linktrace traces a specific MAC address through the service. The peer MEP responds with a linktrace reply message after successful inspection of the linktrace message. The MIPs along the path also process the linktrace message and respond with linktrace replies to the originating MEP if the received linktrace message that has a TTL greater than 1 and forward the linktrace message if a look up of the target MAC address in the Layer 2 FIB is successful. The originating MEP shall expect to receive multiple linktrace replies and from processing the linktrace replies, it can put together the route to the target bridge.
A traced MAC address is carried in the payload of the linktrace message, the target MAC. Each MIP and MEP receiving the linktrace message checks whether it has learned the target MAC address. In order to use linktrace the target MAC address must have been learned by the nodes in the network. If so, a linktrace message is sent back to the originating MEP. Also, a MIP forwards the linktrace message out of the port where the target MAC address was learned.
The linktrace message itself has a multicast destination address. On a broadcast LAN, it can be received by multiple nodes connected to that LAN. But, at most, one node will send a reply.
Figure 33: CFM Linktrace
The IEEE and ITU-T handle the linktrace reply slightly differently. An IEEE 802.1ag configured MEP requires the relay action field to be a valid non-zero integer. The ITU-T ignores the relay action field and will set the value to zero when responding to the LTM. In mixed 802.ag and Y.1731 environments the operator may chose to configure a Y.1731 context with an IEEE domain format.
The following linktrace related functions are supported:
- MEP — Supports generating linktrace messages and responding with linktrace reply messages. The ETH-LT PDU format does not allow a MEP to have more than a single active ETH-LT session.
- MIP — Supports responding to linktrace messages with linktrace reply messages when encoded TTL is greater than 1, and forward the linktrace messages accordingly if a lookup of the target MAC address in the Layer 2 FIB is successful
- Displays linktrace test results on the originating MEP
- SenderID TLV may optionally be configured to carry the ChassisID. When configured, this information will be included in LTM and LTR messages.
- Only the ChassisID portion of the TLV will be included
- The Management Domain and Management Address fields are not supported on transmission
- THE LBM message will include the SenderID TLV that is configure on the launch point. The LBR message will include the SenderID TLV information from the reflector (MIP or MEP) if it is supported.
- Supported for both service (id-permission) and facility MEPs (facility-id-permission).
- Supported for both MEP and MIP
The following output includes the SenderID TLV contents if it is included in the LBR.
Continuity Check (CC)
A Continuity Check Message (CCM) is a multicast frame that is generated by a MEP and multicast to all other MEPs in the same MA. The CCM does not require a reply message. To identify faults, the receiving MEP maintains an internal list of remote MEPs it should be receiving CCM messages from.
This list is based off of the remote-mepid configuration within the association the MEP is created in. When the local MEP does not receive a CCM from one of the configured remote MEPs within a pre-configured period, the local MEP raises an alarm.
Figure 34: CFM Continuity Check
Figure 35: CFM CC Failure Scenario
An MEP may be configured to generate ETH-CC packet using a unicast destination Layer 2 MAC address. This may help reduce the overhead in some operational models where Down MEPs per peer are not available. For example, mapping an I-VPLS to a PBB core where a hub is responsible for multiple spokes is one of the applicable models. When ETH-CFM packets are generated from an I-context toward a remote I-context, the packets will traverse the B-VPLS context. Since many B-contexts are multipoint, any broadcast, unknown or multicast packet is flooded to all appropriate nodes in the B-context. When ETH-CC multicast packets are generated, all the I-VPLS contexts in the association must be configured with all the appropriate remote MEPids. If direct spoke to spoke connectivity is not part of the validation requirement, the operational complexity can be reduced by configuring unicast DA addressing on the “spokes” and continuing to use multicast CCM from the “hub”. When the unicast MAC is learned in the forwarding DB, traffic will be scoped to a single node.
Figure 36: Unicast CCM in Hub & Spoke Environments
Defect condition, reception, and processing will remain unchanged for both hub and spokes. When an ETH-CC defect condition is raised on the hub or spoke, the appropriate defect condition will be set and distributed throughout the association from the multicasting MEP. For example, should a spoke raise a defect condition or timeout, the hub will set the RDI bit in the multicast ETH-CC packet which is received on all spokes. Any local hub MEP defect condition will continue to be propagated in the multicast ETH-CC packet. Defect conditions will be cleared as per normal behavior.
The forwarding plane must be considered before deploying this type of ETH-CC model. A unicast packet will be handled as unknown when the destination MAC does not exist in local forwarding table. If a unicast ETH-CC packet is flooded in a multipoint context, it will reach all the appropriate I-contexts. This will cause the spoke MEPs to raise the “DefErrorCCM” condition because an ETH-CC packet was received from a MEP that has not been configured as part of the receiving MEPs database.
The remote unicast MAC address must be configured and is not automatically learned. A MEP cannot send both unicast and multicast ETH-CC packets. Unicast ETH-CC is only applicable to a local association with a single configured remote peer. There is no validation of MAC addresses for ETH-CC packets. The configured unicast destination MAC address of the peer MEP only replaces the multicast class 1 destination MAC address with a unicast destination.
Unicast CCM is not supported on any MEPs that are configured with sub second CCM-intervals.
The following functions are supported:
- Enable and disable CC for an MEP
- Configure and delete the MEP entries in the CC MEP monitoring database manually. It is only required to provision remote MEPs. Local MEPs shall be automatically put into the database when they are created.
- CCM transmit interval: 10ms, 100ms, 1s, 10s 60s, 600s. Default: 10s. Sub-second, or fast CC requires a 7950 XRS, 7750 SR-7/SR-12/SR-12e with a minimum SF/CPM-3, 7750 ESS-7/ESS-12 with a minimum SF/CPM-3, 7750 SRa, or 7750 SRe, and only a limited number supported on SF/CPM-1 and SF/CPM-2. When configuring MEPs with sub-second CCM intervals, bandwidth consumption must be taken into consideration. Each CCM PDU is approximately 100 bytes (800 bits). Taken individually, this is a small value. However, the bandwidth consumption increases rapidly as multiple MEPs are configured with 10ms timers, 100 packets per second.The following section describes some basic hierarchical considerations and the software requirements and configurations that need to be met when considering sub-second enabled MEPs.
- Down MEPs only
- Single peer only
- Any MD Level
- As long as lower MD level MEPs are not CCM or ETH-APS enabledG.8031 Ethernet-Tunnels enables OpCode39 Linear APSG.8032 Ethernet-Rings enables OpCode 40 Ring APS
- As long as lower MD levels MEPs are not receiving ETH-CCM or ETH-APS PDUs, even if they not locally enabled or configured to do soThe reception of the lower MD level ETH-CCM and ETH-APS PDUs will be processed by the sub second CCM enabled MEP, regardless of MD LevelAll other ETH-CFM PDUs will be handled by the MEP at the MD level matching the PDU that has arrived, assuming one has been configured
- Service MEPs (excluding Primary VLAN MEPs)
- Ethernet SAPs configured on Port with any Ethernet Encapsulation (null, dot1q or QinQ)
- Facility MEPs
- Ethernet Port Based MEPs
- Ethernet LAG Based MEPs
- Ethernet QinQ Tunnel based MEPs (LAG+VLAN, PORT+VLAN)
- Base Router IP Interfaces
- Service MEPs and Facility MEPs can simultaneously execute sub second CCM enabled MEPs as these are considered different MEP families.
- General processing rules for Service MEPs and Facility MEPs must be met regardless of the CCM interval. These are included here because of the impact misunderstanding could have on the CCM extraction.
- All the above rules apply
- MD level hierarchy must be ensured across different families
- Facility MEPs are the first processing routine for ETH-CFM PDUs
- VLAN encapsulation uniqueness must exist when processing the ETH-CFM PDU across the two familiesUnique Example: An Ethernet Port Based Facility Down MEP configured on port 1/1/1 and Service Down MEP SAP 1/1/1:100 (dot1q encaps) are uniqueConflict Example: An Ethernet Port Based Facility Down MEP configured on port 1/1/1 and Service Down MEP SAP 1/1/1 (null encaps) are in conflict and cannot coexist. All ETH-CFM PDUs will arrive untagged and the Facility MEP takes precedence.
- G.8031 (Ethernet-Tunnels) support both sub second and 1 second CCM intervals and optionally no CCM. When the MEP is created on a G.8031 Ethernet-Tunnel no other MEP that is any way connected to the G.8031 Ethernet-Tunnel can execute sub second CCM intervals.
- Facility MEPs are not supported in conjunction with G.8031 (Ethernet-Tunnel MEPs)
- G.8032 (Ethernet-Ring) support both sub second and 1 second CCM intervals and optionally no CCM.
- Facility MEPs are supported in combination with G.8032 MEPs. However, facility MEPs and G.8032 MEPs cannot both execute sub second CCM where the infrastructure is shared. If the operator configures this combination the last updated sub second MEP will overwrite the previous sub second MEP and interrupt the previous configured MEP causing a defRemoteCCM condition.
- The size of the CCM PDU may be increased by configuring the optional Data TLV. This is accomplished by configuring the ccm-padding-size under the specific MEP. The configured value represents the total length of the Data TLV that will be included with the other CCM PDU informational elements. The no form of this command removes the optional Data TLV from the CCM PDU. The operator must consider a CCM PDU is 83 byte size in length (75 base elements plus 8 bytes for port status and interface status). If the size of the optional TLV combined with the size of the CCM PDU exceeds 1500 bytes the packet will be dropped if the MTU is 1518/1522. Applies to the 7450 ESS and 7750 SR only.
- CCM will declare a defect when:
- it stops hearing from one of the remote MEPs for 3.5 times CC interval
- it hears from a MEP with a LOWER MD level
- it hears from a MEP that is not part of the local MEPs MA
- it hears from a MEP that is in the same MA but not in the configured MEP list
- it hears from a MEP in the same MA with the same MEP id as the receiving MEP
- the CC interval of the remote MEP does not match the local configured CC interval
- the remote MEP is declaring a fault
- An alarm is raised and a trap is sent if the defect is greater than or equal to the configured low-priority-defect value.
- Remote Defect Indication (RDI) is supported but by default is not recognized as a defect condition because the low-priority-defect setting default does not include RDI.
- SenderID TLV may optionally be configured to carry the ChassisID. When configured, this information will be included in CCM messages.
- Only the ChassisID portion of the TLV will be included.
- The Management Domain and Management Address fields are not supported on transmission.
- SenderID TLV is not supported with sub second CCM enabled MEPs.
- Supported for both service (id-permission) and facility MEPs (facility-id-permission).
- Alarm notification alarm and reset times are configurable under the MEP. By default, the alarm notification times are set to zero, which means the behavior is immediate logging and resetting. When the value is zero and a previous higher level alarm is reset, if a lower level alarm exist, and is above the low-priority defect, that log event will be created. However, when either of the alarm notification timers are non-zero and a lower priority alarm exists, it will not be logged.
- Alarm (fng-alarm-time) will delay the generation of the log event by the value configured. The alarm must be present for this amount of time before the log event is created. This is for only log event purposes.
- Reset (fng-reset-time) is the amount of time the alarm must be absent before it is cleared.
You can use the optional ccm-tlv-ignore command to ignore the reception of interface-status and port-status TLVs in the ETH-CCM PDU on Facility MEPs (Port, LAG, QinQ Tunnel and Router). No processing is performed on the ignored ETH-CCM TLVs values.
Any TLV that is ignored is reported as absent for that remote peer and the values in the TLV do not have an impact on the ETH-CFM state machine. This the same behavior as if the remote MEP never included the ignored TLVs in the ETH-CCM PDU. If the TLV is not properly formed, the CCM PDU will fail the packet parsing process, which will cause it to be discarded and a defect condition will be raised.
NODE1:
NODE2:
Common CCM attributes are defined within the association, including the list of remote peers and interval. Once this is complete, the MEP configured on the SAP within the service must enabled CCM and the priority of the packet can be set.
NODE1:
NODE2:
There are various display commands that are available to show the status of the MEP and the list of remote peers.
CC Remote Peer Auto-Discovery
As specified in the section “Continuity Checking (CC),” all remote MEP-IDs must be configured under the association using the remote-mepid command in order to accept them as peers. When a CCM is received from a MEP-ID that has not been configured, the “unexpected MEP” will cause the defErrorCCM condition to be raised. The defErrorCCM will be raised for all invalid CC reception conditions.
The auto-mep-discovery option allows for the automatic adding of remote MEP-IDs contained in the received CCM. Once learned, the automatically discovered MEP behave the same as a manually configured entry. This includes the handling and reporting of defect conditions. For example, if an auto discovered MEP is deleted from its host node, it will experience the standard timeout on the node which auto discovered it.
Obviously, when this function is enabled, the “unexpected MEP” condition no longer exists. That is because all MEPs are accepted as peers and automatically added to the MEP database upon reception. There is an exception to this statement. If the maintenance association has reached its maximum MEP count, and no new MEPs can be added, the “unexpected MEP” condition will raise the defErrorCCM defect condition. This is because the MEP was not added to the association and the remote MEP is still transmitting CCM.
The clear eth-cfm auto-discovered-meps [mep-id] domain md-index association ma-index is available to remove auto discovered MEPs from the association. When the optional mep-id is included as part of the clear command, only that specific MEP-ID within the domain and association will be cleared. If the optional mep-id is omitted when the clear command is issued, all auto discovered MEPs that match the domain and association will be cleared. The clear command is only applicable to auto discovered MEPs.
If there is a failure to add a MEP to the MEP database and the action was manual addition using the “remote-mepid” configuration statement, the error “MINOR: ETH_CFM #1203 Reached maximum number of local and remote endpoints configured for this association” will be produced. When failure to add a MEP to the database through an auto discovery, no event is created. The CCM Last Failure indicator tracks the last CCM error condition. The decode can be viewed using the “show eth-cfm mep mep-id domain md-index association ma-index” command. An association may include both the manual addition of remote peers using the remote-mepid and the auto-mep-discovery option.
The all-remote-mepid display includes an additional column AD to indicate where a MEP has been auto discovered, using the indicator T.
Auto discovered MEPs will not survive a system reboot. These are not permanent additions to the MEP database and will be not reload after a reboot. The entries will be relearned when the CCM is received. Auto discovered MEPs can be changed to manually created entries simply by adding the appropriate remote-mepid statement to the proper association. At that point, the MEP is no longer considered auto discovered and can no longer be cleared.
If a remote-mepid statement is removed from the association context and auto-mep-discovery is configured and a CC message arrives from that remote MEP, it will be added to the MEP database, this time as an auto discovered MEP.
The individual MEP database for an association must not exceed the maximum number of MEPs allowed. A MEP database consists of all local MEPs plus all configured remote-mepids and all auto discovered MEPs. If the number of MEPs in the association has reached capacity, no new MEPs may be added in any manner. The number of MEPs must be brought below the maximum value before MEPs can be added. Further, the number of MEPs across all MEP databases must not exceed the system maximum. The number of MEPs supported per association and the total number of MEPs across all associations is dependent of the system SF/CPM.
CCM Grace Period
When an ISSU operation or soft reset function is invoked, the ETH-Vendor Specific Message (ETH-VSM) PDU is used to announce a grace period to a remote CCM enabled peer which are administratively enabled. This Multicast Class 1 DA announcement includes the start of a grace period, the new remote timeout value of 90s and the completion of the grace process. Those MEPs configured with unicast destination MAC addresses will still receive the CCM messages as unicast.
At the start of the operation, a burst of three packets will be sent over a three second window in order to reduce the chances that a remote peer may miss the backoff announcement. This grace announcement will include an indication that the local node that is undergoing a maintenance operation that could possibly delay the announcement of CCM messages at the configured interval.
Three evenly spaced ETH-VSM messages will be sent during the interval advertised in the ETH-VSM message. This means that the ETH-VSM message will be sent every 10 seconds to all appropriate remote peers. Reception of this packet refreshes the timeout calculation. The local node undergoing the maintenance operation will also delay the CCM timeout by the announced ETH-VSM interval. This local interval will be reset when any ETH-CC PDU is received on the MEP. An optional TLV is included in AIS packets to extend timeout values for active AIS conditions.
At the end of the maintenance operation there will be a burst of three more messages over a 10 second window that will indicate that the maintenance operation has completed. Once the first of these messages has been received the receiving peer will transition back to the ETH-CCM message and associated interval as the indication for the remote timeout (3.5*ccm-interval+hold if any).
CCM message will continue to be sent during this process but loss of the CCM packets during this 10s window will not affect the remote peer timeout. The only change to the CCM processing is which timer to use during the maintenance operation. During the operation, the value used is that announced as part of the ETH-VSM message. Outside a maintenance window the standard CCM-interval*3.5 + any configured hold time is used. Since CCM messages are sent during this time other faults and failures can still be conveyed and acted upon. These include AIS, Interface status settings, etc. Only the remote peer timeout (defRemoteCCM) is affected by the ETH-VSM announcement.
The grace announcement using ETH-VSM will continue until the upgrade or reset is completed. During an IOM or line card soft reset ETH-CFM will not determine which peers are affected by a soft reset of a specific IOM or line card. All remote peers will receive the ETH-VSM with the grace period announcement until the soft reset is completed. This means that all remote MEPs, regardless of location on the local node will enter a grace.
Clearing the IOM or line card does not invoke the organizational specific TLV with the grace period announcement.
This is a value added function that is applicable to only nodes that implement support for ALU’s approach for announcing grace using ETH-VSM. As specified in the standards, when a node does not support a specific optional function the message will be ignored and the no processing will be performed.
This feature is enabled by default. A system wide command is available to disable this transmission of these grace messages. Entering the no grace-tx-enable in the configuration under the eth-cfm>system context will prevent the grace announcements. If this configuration option is change from enable to disable while grace is being announced the three grace stop messages will be transmitted. Changing the state of this configuration option from disable to enable will only affect future ISSU and soft reset functions. It will have no affect on any ISSU or soft reset function that is active at the time this command was enabled.
CCM Hold Timers
In some cases the requirement exists to prevent a MEP from entering the defRemoteCCM defect, remote peer timeout, from more time than the standard 3.5 times the CCM-interval. Both the IEEE 802.1ag standard and ITU-T Y.1731 recommendation provide a non-configurable 3.5 times the CCM interval to determine a peer time out. However, when sub second CCM timers (10ms/100ms) are enabled the carrier may want to provide additional time for different network segments to converge before declaring a peer lost because of a timeout. In order to maintain compliance with the specifications the ccm-hold-timer down <delay-down> option has been introduced to artificially increase the amount of time it takes for a MEP to enter a failed state should the peer time out. This timer is only additive to CCM timeout conditions. All other CCM defect conditions, like defMACStatus, defXconCCM, and so on, will maintain their existing behavior of transitioning the MEP to a failed state and raising the proper defect condition without delay.
When the ccm-hold-timer down delay-down option is configured the following calculation is used to determine the remote peer time out (3.5 times the CCM-Interval + ccm-hold-timer delay-down).
This command is configured under the association. Only sub second CCM enabled MEPs support this hold timer. Ethernet-Tunnel Paths use a similar but slightly different approach and will continue to utilize the existing method. Ethernet-tunnels will be blocked from using this new hold timer.
It is possible to change this command on the fly without deleting it first. Simply entering the command with the new values will change to values without having to delete the command prior to the change.
It is possible to change the ccm-interval of a MEP on the fly without first deleting it. This means it is possible to change a sub second CCM enabled MEP to 1 second or above. The operator will be prevented from changing an association from a sub second CCM interval to a non-sub second CCM interval when a ccm-hold-timer is configured in that association. The ccm-hold-timer must be removed using the no option prior to allowing the transition from sub second to non-sub second CCM interval.
Alarm Indication Signal (ETH-AIS Y.1731)
Alarm Indication Signal (AIS) provides a Y.1731-capable MEP with the ability to signal a fault condition in the reverse direction of the MEP, out the passive side. When a fault condition is detected the MEP will generate AIS packets at the configured client levels and at the specified AIS interval until the condition is cleared. Currently a MEP that is configured to generate AIS must do so at a level higher than its own. The MEP configured on the service receiving the AIS packets is required to have the active side facing the receipt of the AIS packet and must be at the same level as the AIS. The absence of an AIS packet for 3.5 times the AIS interval set by the sending node will clear the condition on the receiving MEP.
AIS generation is not subject to the CCM low-priority-defect parameter setting. When enabled, AIS is generated if the MEP enters any defect condition, by default this includes CCM RDI condition.
To prevent the generation of AIS for the CCM RDI condition, the AIS version of the low-priority-defect parameter (under the ais-enable command) can be configured to ignore RDI by setting the parameter value to macRemErrXcon. The low-priority-defect parameter is specific and influences the protocol under which it is configured. When the low-priority-defect parameter is configured under CCM, it only influences CCM and not AIS. When the low-priority-defect parameter is configured under AIS, it only influences AIS and not CCM. Each protocol can make use of this parameter using different values.
AIS configuration has two components: receive and transmit. AIS reception is enabled when the command ais-enable is configured under the MEP. The transmit function is enabled when the client-meg-level is configured.
Alarm Indication Signal function is used to suppress alarms at the client (sub) layer following detection of defect conditions at the server (sub) layer. Due to independent restoration capabilities provided within the Spanning Tree Protocol (STP) environments, ETH-AIS is not expected to be applied in the STP environment.
Transmission of frames with ETH-AIS information can be enabled or disabled on a MEP. Frames with ETH-AIS information can be issued at the client MEG Level by a MEP, including a Server MEP, upon detecting the following conditions:
- Signal failure conditions in the case that ETH-CC is enabled.
- AIS condition in the case that ETH-CC is disabled.
For a point-to-point ETH connection at the client (sub) layer, a client layer MEP can determine that the server (sub) layer entity providing connectivity to its peer MEP has encountered defect condition upon receiving a frame with ETH-AIS information. Alarm suppression is straightforward since a MEP is expected to suppress defect conditions associated only with its peer MEP.
For multipoint ETH connectivity at the client (sub) layer, a client (sub) layer MEP cannot determine the specific server (sub) layer entity that has encountered defect conditions upon receiving a frame with ETH-AIS information. More importantly, it cannot determine the associated subset of its peer MEPs for which it should suppress alarms since the received ETH-AIS information does not contain that information. Therefore, upon receiving a frame with ETH-AIS information, the MEP will suppress alarms for all peer MEPs whether or not there is still connectivity.
Only a MEP, including a Server MEP, is configured to issue frames with ETH-AIS information. Upon detecting a defect condition the MEP can immediately start transmitting periodic frames with ETH-AIS information at a configured client MEG Level. A MEP continues to transmit periodic frames with ETH-AIS information until the defect condition is removed. Upon receiving a frame with ETH-AIS information from its server (sub) layer, a client (sub) layer MEP detects AIS condition and suppresses alarms associated with all its peer MEPs. A MEP resumes alarm generation upon detecting defect conditions once AIS condition is cleared.
AIS may also be triggered or cleared based on the state of the entity over which it has been enabled. Including the optional command interface-support-enable under the ais-enable command will track the state of the entity and invoke the appropriate AIS action. This means that operators are not required to enable CCM on a MEP in order to generate AIS if the only requirement is to track the local entity. If a CCM enabled MEP is enabled in addition to this function then both will be used to act upon the AIS function. When both CCM and interface support are enabled, a fault in either will trigger AIS. In order to clear the AIS state, the entity must be in an UP operational state and there must be no defects associated with the MEP. The interface support function is available on both service MEPs and facility MEPs both in the Down direction only, with the following exception. An Ethernet QinQ Tunnel Facility MEP does not support interface-support-enable. Many operational models for Ethernet QinQ Tunnel Facility MEPs are deployed with the SAP in the shutdown state.
The following specific configuration information is used by a MEP to support ETH-AIS:
- Client MEG Level — MEG level at which the most immediate client layer MIPs and MEPs exist.
- ETH-AIS transmission period — Determines the transmission period of frames with ETH-AIS information.
- Priority — Identifies the priority of frames with ETH-AIS information.
- Drop Eligibility — Frames with ETH-AIS information are always marked as drop ineligible.
- Interface-support-enable — Optional configuration to track the state of the entity over which the MEP is configured.
- Low-priority-defect — Optional configuration to exclude the CCM RDI condition from triggering the generation of AIS.
A MIP is transparent to frames with ETH-AIS information and therefore does not require any information to support ETH-AIS functionality.
It is important to note that Facility MEPs do not support the generation of AIS to an explicitly configured endpoint. An explicitly configured endpoint is an object that contains multiple individual endpoints, as in pseudowire redundancy.
AIS is enabled under the service and has two parts, receive and transmit. Both components have their own configuration option. The ais-enable command under the SAP allows for the processing of received AIS packets at the MEP level. The client-meg-level command is the transmit portion that generates AIS if the MEP enter a fault state.
When MEP 101 enters a defect state, it starts to generate AIS out the passive side of the MEP, away from the fault. In this case, the AIS generates out sap 1/1/10:100.31 since MEP 101 is an up MEP on that SAP. The Defect Flag indicates that an RDI error state has been encountered. The Eth-Ais Tx Counted value is increasing, indicating that AIS is actively being sent.
A single network event may, in turn, cause the number of AIS transmissions to exceed the AIS transmit rate of the network element. A pacing mechanism is in place to assist the network element to gracefully handle this overload condition. Should an event occur that causes the AIS transmit requirements to exceed the AIS transmit resources, a credit system is used to grant access to the resources. Once all the credits have been used, any remaining MEPs attempting to allocate a transmit resource will be placed on a wait list, unable to transmit AIS. Should a credit be released, when the condition that caused the MEP to transmit AIS is cleared, a MEP on the wait list will consume the newly available credit. If it is critical that AIS transmit resources be available for every potential event, consideration must be given to the worst case scenario and the configuration should never exceed the potential. Access to the resources and the wait list are ordered and maintained in first come first serve basis.
A MEP that is on the wait list will only increment the “Eth-Ais Tx Fail” counter and not the “Eth-Ais TxCount” for every failed attempt while the MEP is on the wait list.
There is no synchronization of AIS transmission state between peer nodes. This is particularly important when AIS is used to propagate fault in ETH-CFM MC-LAG linked designs.
Client Signal Fail (ETH-CSF Y.1731)
Client signal fail (CSF) is a method that allows for the propagation of a fault condition to a MEP peer, without requiring ETH-CC or ETH-AIS. The message is sent when a MEP detects an issue with the entity in the direction the MEP to its peer MEP. A typical deployment model is an UP MEP configured on the entity that is not executing ETH-CC with its peer. When the entity over which the MEP is configured fails, the MEP can send the ETH-CSF fault message.
In order to process the reception of the ETH-CSF message, the csf-enable function must be enabled under the MEP. When processing of the received CSF message is enabled, the CSF is used as another method to trigger fault propagation, assuming fault propagation is enabled. If CSF is enabled but fault propagation is not enabled, the MEP will show state of CSF being received from the peer. And lastly, when there is no fault condition, the CSF Rx State will display DCI (Client defect clear) indicating there are no existing failures, even if no CSF has been received. The CSF Rx State will indicate the various fault and clear conditions received from the peer during the event.
CSF carries the type of defect that has been detected by the local MEP generating the CSF message.
- 000 – LOS – Client Loss of Signal
- 001 – FDI/AIS – Client forward defect indication
- 010 – RDI – Client reverse defect indication
Clearing the CSF state can be either implicit, time out, or explicit, requiring the client to send the PDU with the clear indicator (011 – DCI – Client defect clear indication). The receiving node uses the multiplier option to determine how to clear the CSF condition. When the multiplier is configured as non zero (in increments of half seconds between 2 and 30) the CSF will be cleared when CSF PDUs have not been received for that duration. A multiplier value of 0 means that the peer that has generated the CSF must send the 011 – DCI flags. There is no timeout condition.
Service-based MEP supports the reception of the ETH-CSF as an additional trigger for the fault propagation process. Primary VLAN and Virtual MEPs do not support the processing of the CSF PDU. CSF is transparent to MIPs. There is no support for the transmission of ETH-CSF packets on any MEP.
Test (ETH-TST Y.1731)
Ethernet test affords operators an Y.1731 capable MEP the ability to send an in service on demand function to test connectivity between two MEPs. The test is generated on the local MEP and the results are verified on the destination MEP. Any ETH-TST packet generated that exceeds the MTU will be silently dropped by the lower level processing of the node.
Specific configuration information required by a MEP to support ETH-test is the following:
- MEG level — MEG level at which the MEP exists
- Unicast MAC address of the peer MEP for which ETH-test is intended.
- Data - Optional element whose length and contents are configurable at the MEP.
- Priority — Identifies the priority of frames with ETH-Test information.
- Drop Eligibility — Identifies the eligibility of frames with ETHTest information to be dropped when congestion conditions are encountered.
A MIP is transparent to the frames with ETH-Test information and does not require any configuration information to support ETH-Test functionality.
Both nodes require the eth-test function to be enabled in order to successfully execute the test. Since this is a dual-ended test, initiate on sender with results calculated on the receiver, both nodes need to be check to see the results.
One-Way Delay Measurement (ETH-1DM Y.1731)
One-way delay measurement allows the operator the ability to check unidirectional delay between MEPs and applies to the 7450 ESS and 7750 SR only. An ETH-1DM packet is time stamped by the generating MEP and sent to the remote node. The remote node time stamps the packet on receipt and generates the results. The results, available from the receiving MEP, will indicate the delay and jitter. Jitter, or delay variation, is the difference in delay between tests. This means the delay variation on the first test will not be valid. It is important to ensure that the clocks are synchronized on both nodes to ensure the results are accurate. NTP can be used to achieve a level of wall clock synchronization between the nodes.
| Note:
Accuracy relies on the nodes ability to timestamp the packet in hardware. Network elements that do not support this hardware time stamping, like the ESS-1, will display different results than hardware timestamp capable devices, like the SR-7/SR-12 and ESS-7/ESS-12. |
Two-Way Delay Measurement (ETH-DMM Y.1731)
Two-way delay measurement is similar to one way delay measurement except it measures the round trip delay from the generating MEP. In this case wall clock synchronization issues will not influence the test results because four timestamps are used. This allows the remote nodes time to be removed from the calculation and as a result clock variances are not included in the results. The same consideration for first test and hardware based time stamping stated for one way delay measurement are applicable to two-way delay measurement.
Delay can be measured using one-way and two-way on demand functions. The two-way test results are available single-ended, test initiated, calculation and results viewed on the same node. There is no specific configuration under the MEP on the SAP in order to enabled this function. An example of an on demand test and results are below. The latest test result is stored for viewing. Further tests will overwrite the previous results. Delay Variation is only valid if more than one test has been executed.
Synthetic Loss Measurement (ETH-SLM Y.1731)
| Note:
Release 9.0R1 uses pre-standard OpCodes and will not interoperate with any other release or future release. |
This synthetic loss measurement approach is a single-ended feature that allows the operator to run on-demand and proactive tests to determine “in”, “out” loss and “unacknowledged” packets. This approach can be used between peer MEPs in both point to point and multipoint services. Only remote MEP peers within the association and matching the unicast destination will respond to the SLM packet.
The specification uses various sequence numbers in order to determine in which direction the loss occurred. ALU has implemented the required counters to determine loss in each direction. In order to properly use the information that is gathered the following terms are defined;
- Count — The number of probes that are sent when the last frame is not lost. When the last frame(s) is/are lost, the count + unacknowledged equals the number of probes sent.
- Out-Loss (Far-end) — Packets lost on the way to the remote node, from test initiator to test destination
- In-Loss (Near-end) — Packet loss on the way back from the remote node to the test initiator.
- Unacknowledged — Number of packets at the end of the test that were not responded to.
The per probe specific loss indicators are available when looking at the on-demand test runs, or the individual probe information stored in the MIB. When tests are scheduled by Service Assurance Application (SAA) the per probe data is summarized and per probe information is not maintained. Any “unacknowledged” packets will be recorded as “in-loss” when summarized.
The on-demand function can be executed from CLI or SNMP. The on demand tests are meant to provide the carrier a means to perform on the spot testing. However, this approach is not meant as a method for storing archived data for later processing. The probe count for on demand SLM has a range of one to 100 with configurable probe spacing between one second and ten seconds. This means it is possible that a single test run can be up to 1000 seconds in length. Although possible, it is more likely the majority of on demand case will be run up to 100 probes or less at a one second interval. A node may only initiate and maintain a single active on demand SLM test at any given time. A maximum of one storage entry per remote MEP is maintained in the results table. Subsequent runs to the same peer will overwrite the results for that peer. This means when using on demand testing the test should be run and the results checked prior to starting another test.
The proactive measurement functions are linked to SAA. This backend provides the scheduling, storage and summarization capabilities. Scheduling may be either continuous or periodic. It also allows for the interpretation and representation of data that may enhance the specification. As an example, an optional TVL has been included to allow for the measurement of both loss and delay/jitter with a single test. The implementation does not cause any interoperability because the optional TVL will be ignored by equipment that does not support this. In mixed vendor environments loss measurement will continue to be tracked but delay and jitter will only report round trip times. It is important to point out that the round trip times in this mixed vendor environments will include the remote nodes processing time because only two time stamps will be included in the packet. In an environment where both nodes support the optional TLV to include time stamps unidirectional and round trip times will be reported. Since all four time stamps are included in the packet the round trip time in this case will not include remote node processing time. Of course, those operators that wish to run delay measurement and loss measurement at different frequencies are free to run both ETH-SL and ETH-DM functions. ETH-SL is not replacing ETH-DM. Service Assurance is only briefly discussed here to provide some background on the basic functionality. In order to completely understand how SAA functions please refer to the appropriate section of the user guide.
The ETH-SL packet format contains a test-id that will be internally generated and not configurable. The test-id will be visible for the on demand test in the display summary. It is possible a remote node processing the SLM frames will receive overlapping test-ids as a result of multiple MEPs measuring loss between the same remote MEP. For this reason, the uniqueness of the test is based on remote MEP-ID, test-id and Source MAC of the packet.
ETH-SL is applicable to up and down MEPs and as per the recommendation transparent to MIPs. There is no coordination between various fault conditions that could impact loss measurement. This is also true for conditions where MEPs are placed in shutdown state as a result of linkage to a redundancy scheme like MC-LAG. Loss measurement is based on the ETH-SL and not coordinated across different functional aspects on the network element. ETH-SL is supported on service based MEPs.
It is possible that two MEPs may be configured with the same MAC on different remote nodes. This will cause various issues in the FDB for multipoint services and is considered a misconfiguration for most services. It is possible to have a valid configuration where multiple MEPs on the same remote node have the same MAC. In fact, this is somewhat likely. In this release, only the first responder will be used to measure packet loss. The second responder will be dropped. Since the same MAC for multiple MEPs is only truly valid on the same remote node this should is an acceptable approach.
There is no way for the responding node to understand when a test is completed. For this reason a configurable inactivity-timer determines the length of time a test is valid. The timer will maintain an active test as long as it is receiving packets for that specific test, defined by the test-id, remote MEP Id and source MAC. When there is a gap between the packets that exceeds the inactivity timer value, the responding node releases the index in the table and responds with a sequence number of 1, regardless of the sequence number sent by the instantiating node. Expiration of this timer causes the reflecting peer to expire the previous test. Any packets that follow the expiration of a text will be viewed as a new test. The default for the inactivity-timer is 100 second and has a range of ten to 100 seconds.
Only the configuration is supported by HA. There will be no synchronization of data between active and standby. Any unwritten, or active tests will be lost during a switchover and the data will not be recoverable.
ETH-SL provides a mechanism for operators to pro-actively trend packet loss.
Configuration Example
Figure 37shows the configuration required for proactive SLM test using SAA.
Figure 37: SLM Example
The output from the MIB is shown below as an example of an on-demand test. Node1 is tested for this example. The SAA configuration does not include the accounting policy required to collect the statistics before they are overwritten. NODE2 does not have an SAA configuration. NODE2 includes the configuration to build the MEP in the VPLS service context.
The following sample output is meant to demonstrate the different loss conditions that an operator may see. The total number of attempts is “99” is because the final probe in the test was not acknowledged.
Frame Loss Measurement (ETH-LMM Y.1731)
The ETH-LMM Y.1731 approach to Ethernet loss measurement allows for the collection of frame counters in order to determine the unidirectional frame loss between point-to-point ETH-CFM MEP peers. This loss measurement does not rely on the counting of its own PDU in order to determine unidirectional loss. The protocol PDU includes four counters which represent the data sent and received in each direction: Transmit Forward (TxFCf), Receive Forward (RxFCf), Transmit Backward (TxFCb) and the Receive Backward (RxFC1).
The protocol is designed only for point-to-point connections. It is impossible for the protocol to properly report loss if the point-to-point relationship is broken; for example, if a SAP or MPLS binding is receiving data from multiple peers, as could be the case in VPLS deployments, this protocol cannot be used in any reliable fashion.
The loss differential between transmit and receive is determined the first time an LMM PDU is sent. Each subsequent PDU for a specific test will perform a computation of differential loss from that epoch. Each processing cycle for an LMR PDU will determine if there is a new maximum of minimum loss window, add any new loss to the frame loss ratio computation, and update the four raw transmit and receive counters. The individual probe results are not maintained; these results are only used to determine a new minimum of maximum. A running total of all Tx and Rx values is used to determine the average Frame Loss Ratio (FLR) at the completion of the measurement interval. The data set includes the protocol information in the opening header, followed by the frame counts in each direction, and finally the FLR percentages.
Service frame recording does have some caveats that need to be understood before selecting this method of loss measurement. Statistics are maintained per forwarding complex. Multiple path environments may spread frames between the same two peers across different forwarding complexes (for example, link aggregation groups). The ETH-LMM Y.1731 protocol has no means of rationalizing different transmit and receive statistics when there are complex changes or when any statistics have been cleared on either of the peer entities. The protocol will resynchronize but the data collected for that measurement interval will be invalid. The protocol has no method to determine if the loss is true loss or whether some type of complex switch has occurred or statistics were cleared and as such cannot use any suspect flag to mark the data as invalid. Higher level systems must coordinate network events and administrative actions that can cause the counters to become non-representative of the service data loss.
Packet reordering also affect frame loss and gain reporting. If there is queuing contention on the local node, or if there are path differences in the network that cause frames to be interleaved or delayed, the counter stamped into the LMM PDU could introduce frame gain or loss in either direction. For example, if the LMM PDU is stamped with the TxFCf counter and the LMM PDU traffic is interleaved but the interleaving can not be accounted for in the counter, then a potential gain would be realized in the forward direction. This is because the original counter included as the TxFCf value would not have included those interleaved packets, but the RxFCf counter on the remote peer would include those packets. Gains and losses will even out over the life of the measurement interval. Absolute values will be used for any negative values, per interval or at the end of the measurement interval.
With ETH-LMM Y.1731, a single per SAP or per MPLS SDP binding or per facility counter is maintained. This single counter model applies to any conflicting entity that attempts to collect per entity statistics that may cover the same resource. This means that per service and facility MEP LMM counting is not supported. The operator must choose one type of facility MEP or the service level MEP. If a facility MEP is chosen (Port, LAG, QinQ Tunnel or Base Router Interface) care must be taken to ensure the highest configured MEP performs the loss collection routine. Configuring loss collection on a lower level MEP will lead to additive gain introduced in both directions. Although the collection statement is not blocked by CLI or SNMP when there are potential conflicts only one will be accurate. The operator must be aware of lower level resource conflicts. For example, a null based service SAP, any default SAP context or SAP that covers the entire port or facility resource, such as sap 1/1/1, will always count the frame base loss counter against the SAP and never the port, regardless of the presences of a MEP or the collect-lmm-stats configuration on the SAP. Resource contention extends beyond the sharing of common resources used for packet counting and extraction. There is also protocol level contention. For example, the Cflowd cannot be counted or sampled on an entity that is collecting LMM stats. Collection of per Ethernet SAP or per MPLS SDP binding or per facility is not enabled by default. In order for this feature to function with accurate measurements, the collect-lmm-stats is required under the ETH-CFM context for the Ethernet SAP or MPLS SDP binding or under the MEP in the case of the facility MEP. If this command is not enabled on the launch or reflector, the data in the LMM and LMR PDU will not be representative and the data captured will be invalid. The show>service>sdp-using eth-cfm and show>service>sap-using eth-cfm commands have been expanded to include the collect-lmm-stats option for service based MEPs. The show>eth-cfm>cfm-stack-table facility command has been expanded to include collect-lmm-stats to view all facility MEPs. Using these commands with this new option will display which entities are currently collecting LMM counter.
The counter will include all frames that are transmitted or received regardless of class of service or discard eligibility markings. Locally transmitted and locally terminated ETH-CFM frames on the peer collecting the statistics will not be included in the counter. However, there are deployment models that will introduce artificial frame loss or gain when the ETH-CFM launch node and the terminating node for some ETH-CFM packets are not the same peers. Figure 38 demonstrates this issue.
Figure 38: Mismatched LMM Statistical Counters
Launching a single-ended test is under the control of the OAM Performance Monitoring (OAM-PM) architecture and as such adheres to those rules. The ETH-LMM Y.1731 functionality is not available through interactive CLI or interactive SNMP, it is only available under the OAM-PM configuration. This includes the assignment of a Test-Id. This protocol does not carry the 4-byte test id in the packet. This is for local significance and uniformity with other protocols under the control of the OAM-PM architecture. A single LMM test can be configured and executed between the same two ETH-CFM MEP peers. Support is included for point-to-point up and Up and Down Service MEPs and Down Facility MEPs (Port, LAG and Base Router Interfaces). Base router interface accuracy may be affected by the layer two layer three inter-working functions, routing protocol, ACLs, policies, and other layer three functions that were never meant to be accounted for by an Ethernet frame loss measurement tool. Launch functions require IOM3/IMM and beyond as well as a minimum of SF/CPM3. A node reflecting the ETH-LMM PDU requires IOM3/IMM but does not require a SF/CPM3.
There is no support for ETH-LMM UP MEPs in an I-VPLS or PBB ePipe. Configuring this will result in LMM PDU being discarded on the remote BVPLS peer. There is no support for ETH-LMM when Primary VLANs are configured against the MEP. If the SAP over which the UP MEP is configured is not operational the LMM or LMR transmissions will fail. This is because the SAP which stores the counters is unavailable to the LMM PDU. QinQ Tunnel collection will be the aggregate of all outer VLANs that share the VLAN with the tunnel. If the QinQ is configured to collect LMM statistics then any Service MEP that shares the same VLAN as the QinQ tunnel will be blocked from configuring the collect-lmm-stats command. The reverse is also true. If a fully qualified SAP is configured to collect LMM statistics the QinQ tunnel that shares that outer VLAN will be block from configuring collect-lmm-stats.
ETH-CFM Statistics
A number of statistics are available to view the current overall processing requirements for CFM. Any packet that is counted against the CFM resource will be included in the statistics counters. These counters do not include the counting of sub-second CCM, ETH-CFM PDUs that are generated by non-ETH-CFM functions (which includes OAM-PM & SAA) or are filtered by an applicable security configuration.
SAA and OAM-PM use standard CFM PDUs. The reception of these packets are included in the receive statistics. However, these two functions are responsible for launching their own test packets and do not consume ETH-CFM transmission resources.
Per system and per MEP statistics are available with a per OpCode breakdown. Use the show eth-cfm statistics command to view the statistics at the system level. Use the show eth-cfm mep mep-id domain md-index association ma-index statistics command to view the per MEP statistics. These statistics may be cleared by substituting the clear command for the show command. The clear function will only clear the statistics for that function. For example, clear the system statistics does not clear the individual MEP statistics, each maintain their own unique counters.
All known OpCodes are listed in transmit and receive columns. Different versions for the same OpCode are not distinguished for this display. This does not imply the network element supports all listed functions in the table. Unknown OpCodes will be dropped.
It is also possible to view the top ten active MEPs on the system. The term active can be defined as any MEP that is in a “no shutdown” state. The tools dump eth-cfm top-active-meps can be used to see the top ten active MEPs on the system. The counts will be based from the last time to command was issued with the clear option. MEPs that are in a shutdown state are still terminating packets, but these will not show up on the active list.
These statistics help operators to determine the busiest active MEPs on the system as well a breakdown of per OpCode processing at the system and MEP level.
ETH-CFM Packet Debug
The debug infrastructure supports the decoding of both received and transmitted valid ETH-CFM packets for MEPs and MIPs that have been tagged for decoding. The eth-cfm hierarchy has been added to the existing debug CLI command tree. When a MEP or MIP is tagged by the debug process, valid ETH-CFM PDUs that allocate ETH-CFM transmit and receive resources will be decoded and presented to the logging infrastructure for operator analysis. Fixed queue limits restrict the overall packet rate for decoding. The receive and transmit ETH-CFM debug queues are serviced independently. Receive and transmit correlation is not maintained across the receive and transmit debug queues. The tools dump eth-cfm debug-packet command will display message queue exceptions.
Valid ETH-CFM packets must pass a multiple-phase validity check before being passed to the debug parsing function. MAC addresses must be non-zero. If the destination MAC address is multicast, the last nibble of the multicast address must match the expected level of a MEP or MIP tagged for decoding. Packet length and TLV formation, usage, and, where applicable, field validation is performed. Finally, the OpCode-specific TLV structural checks are performed against the remainder of the PDU.
An ETH-CFM packet that passes the validation process is passed to the debug decoding process for tagged MEPs or MIPs. The decoding process parses the PDU for analysis. Truncation of individual TLVs will occur when:
- TLV processing requires multiple functions; this occurs with TLVs that include sub-fields
- an Organizational Specific TLV exists
- padding has been added, as in the case of the optional Data or Test TLVs
- an unknown OpCode is detected; the decode process will process the generic ETH-CFM header with a hex dump for unknown fields and TLVs
The number of printable bytes is dependent on the reason for truncation.
Any standard fields in the PDU that are defined for a certain length with a Must Be Zero (MBZ) attribute in the specification will be decoded based on the specification field length. There is no assumption that packets adhere to the MBZ requirement in the byte field; for example, the MEP-ID is a 2-byte field with three reserved MBZ bits, which translates into a standard MEP-ID range of 0 to 8191. If the MBZ bits are violated, then the 2-byte field will be decoded using all non-zero bits in the 2-byte field.
The decoding function is logically positioned between ETH-CFM and the forwarding plane. Any ETH-CFM PDU discarded by an applicable security configuration will not be passed to the debug function. Care must be taken when interpreting specific ETH-CFM PDU decodes. Those PDUs that have additional, subsequent, or augmented information applied by the forwarding mechanisms may not be part of the decoded packet. Examples of exclusions include sub-second CCM and ETH-CFM PDUs that are generated by non-ETH-CFM functions (which includes OAM-PM and SAA). Augmentation includes the timestamp applied to ETH-CFM PDUs by the forwarding plane. Any packet that is discarded by a security mechanism, including squelching (config>service>sap>eth-cfm>squelch-ingress-levels) or CPU protection (config>service>sap>eth-cfm>cpu-protection ... eth-cfm-monitoring), will bypass the decoding function.
This function allows for enhanced troubleshooting for ETH-CFM PDUs to and from tagged MEPs and MIPs. Only defined and node-supported functionality will be decoded, possibly with truncation. Unsupported or unknown functionality on the node is treated on a best-effort basis, typically handled with a decode producing a truncated number of hex bytes.
This functionality does not support decoding of sub-second CCM, any ETH-CFM PDUs that are processed by non-ETH-CFM entities (which includes OAM-PM and SAA CFM transmit functions), or MIPs created using the default-domain table.
ETH-CFM CoS Considerations
UP MEPs and Down MEPs have been aligned as of this release to better emulate service data. When an UP MEP or DOWN MEP is the source of the ETH-CFM PDU the priority value configured, as part of the configuration of the MEP or specific test, will be treated as the Forwarding Class (FC) by the egress QoS policy. If there is no egress QoS policy the priority value will be mapped to the CoS values in the frame. An ETH-CFM frame utilizing VLAN tags will have the DEI bit mark the frame as “discard ineligible”. However, egress QoS Policy may overwrite this original value. The Service Assurance Agent (SAA) uses [fc {fc-name} [profile {in|out}]] to accomplish similar functionality.
UP MEPs and DOWN MEPs terminating an ETH-CFM PDU will use the received FC as the return priority for the appropriate response, again feeding into the egress QoS policy as the FC.
ETH-CFM PDUs received on the MPLS-SDP bindings will now properly pass the EXP bit values to the ETH-CFM application to be used in the response.
These are default behavioral changes without CLI options.
This does not include Ethernet Linktrace Response (ETH-LTR). The specification requires the highest priority on the bridge port should be used in response to an Ethernet Linktrace Message (ETH-LTM). This provides the highest possible chance of the response returning to the source. Operators may configure the linktrace response priority of the MEP using the ccm-ltm-priority. MIPs inherit the MEPs priority unless the mip-ltr-priority is configured under the bridging instance for the association (config>eth-cfm>domain>assoc>bridge).
OAM Mapping
OAM mapping is a mechanism that enables a way of deploying OAM end-to-end in a network where different OAM tools are used in different segments. For instance, an Epipe service could span across the network using Ethernet access (CFM used for OAM), pseudowire (T-LDP status signaling used for OAM), and Ethernet access (E-LMI used for OAM). Another example allows an Ipipe service, where one end is Ethernet and the other end is Frame Relay, ATM, PPP, MLPPP, or HDLC.
In the SR OS implementation, the Service Manager (SMGR) is used as the central point of OAM mapping. It receives and processes the events from different OAM components, then decides the actions to take, including triggering OAM events to remote peers.
Fault propagation for CFM is by default disabled at the MEP level to maintain backward compatibility. When required, it can be explicitly enabled by configuration.
Fault propagation for a MEP can only be enabled when the MA is comprised of no more than two MEPs (point-to-point).
Fault propagation cannot be enabled for eth-tun control MEPs (MEPs configured under the eth-tun primary and protection paths). However, failure of the eth-tun (meaning both paths fail) will be propagated by SMGR because all the SAPs on the eth-tun will go down.
This section describes the following topics:
CFM Connectivity Fault Conditions
CFM MEP declares a connectivity fault when its defect flag is equal to or higher than its configured lowest defect priority. The defect can be any of the following depending on configuration:
- DefRDICCM: Remote Defect Indication. Remote MEP is declaring a fault by setting the RDI bit in the CCM PDU. Typically a result of raising a local defect based on of the CCM or lack of CCM from an expected or unexpected peer. A feedback loop into the association as a notification since CCM is multicast message with no response.
- DefMACstatus: MAC layer issue. Remote MEP is indicating remote port or interface status not operational.
- DefRemoteCCM: No communication from remote peer. MEP not receiving CCM from an expected remote peer. Timeout of CCM occurs in 3.5 x CC interval.
- DefErrorCCM: Remote configuration does not match local expectations. Receiving CC from remote MEP with inconsistent timers, lower MD/MEG level within same MA/MEG, MEP receiving CCM with its own MEP ID within same MA/MEG.
- DefXconCCM: Cross-connected services. MEP receiving CCM from different MA/MEG.
The following additional fault condition applies to Y.1731 MEPs:
- Reception of AIS for the local MEP level
Setting the lowest defect priority to allDef may cause problems when fault propagation is enabled in the MEP. In this scenario, when MEP A sends CCM to MEP B with interface status down, MEP B will respond with a CCM with RDI set. If MEP A is configured to accept RDI as a fault, then it gets into a dead lock state, where both MEPs will declare fault and never be able to recover. The default lowest defect priority is DefMACstatus. In general terms, when a MEP propagates fault to a peer the peer receiving the fault must not reciprocate with a fault back to the originating MEP with a fault condition equal to or higher than the originating MEP low-priority-defect setting. It is also very important that different Ethernet OAM strategies should not overlap the span of each other. In some cases, independent functions attempting to perform their normal fault handling can negatively impact the other. This interaction can lead to fault propagation in the direction toward the original fault, a false positive, or worse, a deadlock condition that may require the operator to modify the configuration to escape the condition. For example, overlapping Link Loss Forwarding (LLF) and ETH-CFM fault propagation could cause these issues.
CFM Fault Propagation Methods
When CFM is the OAM module at the other end, it is required to use any of the following methods (depending on local configuration) to notify the remote peer:
- Generating AIS for certain MEP levels
- Sending CCM with interface status TLV “down”
- Stopping CCM transmission
For using AIS for fault propagation, AIS must be enabled for the MEP. The AIS configuration needs to be updated to support the MD level of the MEP (currently it only supports the levels above the local MD level).
Note that the existing AIS procedure still applies even when fault propagation is disabled for the service or the MEP. For example, when a MEP loses connectivity to a configured remote MEP, it generates AIS if it is enabled. The new procedure that is defined in this document introduces a new fault condition for AIS generation, fault propagated from SMGR, that is used when fault propagation is enabled for the service and the MEP.
The transmission of CCM with interface status TLV is triggered and does not wait for the expiration of the remaining CCM interval transmission. This rule applies to CFM fault notification for all services.
For a specific SAP/SDP-binding, CFM and SMGR can only propagate one single fault to each other for each direction (up or down).
When there are multiple MEPs (at different levels) on a single SAP/SDP-binding, the fault reported from CFM to SMGR will be the logical OR of results from all MEPs. Basically, the first fault from any MEP will be reported, and the fault will not be cleared as long as there is a fault in any local MEP on the SAP/SDP-binding.
Epipe Services
Down and up MEPs are supported for Epipe services as well as fault propagation. When there are both up and down MEPs configured in the same SAP/SDP-binding and both MEPs have fault propagation enabled, a fault detected by one of them will be propagated to the other, which in turn will propagate fault in its own direction.
CFM Detected Fault
When a MEP detects a fault and fault propagation is enabled for the MEP, CFM needs to communicate the fault to SMGR, so SMGR will mark the SAP/SDP-binding faulty but still operup. CFM traffic can still be transmitted to or received from the SAP/SDP-binding to ensure when the fault is cleared, the SAP will go back to normal operational state. Since the operational status of the SAP/SDP-binding is not affected by the fault, no fault handling is performed. For example, applications relying on the operational status are not affected.
If the MEP is an up MEP, the fault is propagated to the OAM components on the same SAP/SDPbinding; if the MEP is a down MEP, the fault is propagated to the OAM components on the mate SAP/SDP-binding at the other side of the service.
SAP/SDP-Binding Failure (Including Pseudowire Status)
When a SAP/SDP-binding becomes faulty (oper-down, admin-down, or pseudowire status faulty), SMGR needs to propagate the fault to up MEP(s) on the same SAP/SDP-bindings about the fault, as well as to OAM components (such as down MEPs and E-LMI) on the mate SAP/SDP-binding.
Service Down
This section describes procedures for the scenario where an Epipe service is down due to the following:
- Service is administratively shutdown. When service is administratively shutdown, the fault is propagated to the SAP/SDP-bindings in the service.
- If the Epipe service is used as a PBB tunnel into a B-VPLS, the Epipe service is also considered operationally down when the B-VPLS service is administratively shutdown or operationally down. If this is the case, fault is propagated to the Epipe SAP.
- In addition, one or more SAPs/SDP-bindings in the B-VPLS can be configured to propagate fault to this Epipe (see fault-propagation-bmac below). If the B-VPLS is operationally up but all of these entities have detected fault or are down, the fault is propagated to this Epipe’s SAP.
Interaction with Pseudowire Redundancy
When a fault occurs on the SAP side, the pseudowire status bit is set for both active and standby pseudowires. When only one of the pseudowire is faulty, SMGR does not notify CFM. The notification occurs only when both pseudowire becomes faulty. The SMGR propagates the fault to CFM.
Since there is no fault handling in the pipe service, any CFM fault detected on an SDP binding is not used in the pseudowire redundancy’s algorithm to choose the most suitable SDP binding to transmit on.
Ipipe Services
CFM Detected Fault
Deployment of solutions that include legacy to Ethernet aggregation should involve fault inter-working consideration. Protocols like Frame Relay propagate fault using the Local Management Interface (LMI). However, other protocols do not include a dedicated management interface over which to indicate fault. PPP, MLPPP and Cisco HDLC must use a different mechanism to communicate fault between the two different connection types.
The eth-legacy-fault-notification option and the associated parameters along with Ethernet CFM fault propagation on the Ethernet SAP MEP must be enabled in order to properly inter-work the Ethernet and PPP, MLPPP or Cisco HDLC connections. Figure 39 shows the various high level functions that inter-work Ethernet aggregation and legacy interfaces using point to point Ipipe services.
Figure 39: Fault Propagation Model
In general the Ipipe service requires the ce-address information to be learned or manually configured as part of the Ethernet SAP object before the legacy interface connection can be established. IPv6 includes an optimization that uses the Link Local IPv6 address to start the legacy negotiation process and does not require the ce-addressing described previously. This IPv6 optimization does not align well with fault inter-working functions and is disabled when the eth-legacy-fault-notification function is enabled.
Fault propagation is not active from the Ethernet SAP to the legacy connection if the ce-address information for the Ethernet SAP has not been learned or configured. If both IPv4 and IPv6 are configured, each protocol will require ce-addressing to be learned or configured enabling fault inter-working for that protocol. Once the ce-address has been learned or configured for that protocol, fault inter-working will be active for that protocol. If either IPv4 or IPv6 ce-addressing from the Ethernet SAP is resident, the access legacy SAP will be operational. The NCP layer will indicate which unique protocol is operational. Fault propagation toward the Ethernet SAP from the legacy connection will still be propagated even if the ce-address is not resident within the Ipipe under the following conditions; if any SAP or the Service is shutdown, or the legacy SAP is not configured.
The learned Ethernet ce-address is a critical component in Ipipe service operation and fault propagation. In order to maintain the address information the keep option must be configured as part of the ce-address-discovery command. If the keep command is not configured, the address information is lost when the Ethernet SAP transitions to a non-operational state. When the address information is flushed, the Ipipe service will propagate the fault to the legacy PPP, MLPPP and Cisco HDLC connections. The lack of the ce-addressing on the Ethernet SAPs may cause a deadlock condition that requires operator intervention to resolve the issue. The keep command must be configured when the eth-legacy-fault-notification functionality is enabled with PPP, MLPPP and Cisco HDLC legacy interfaces, and fault propagation is required using this type of aggregation deployment. The keep option is specific to and only supported when eth-legacy-fault-notification is configured. If the keep option is configured as part of the ce-address-discovery command, the eth-legacy-fault-propagation cannot be removed. Configuration changes to the ce-address-discovery command may affect the stored ce-address information. For example, if the eth-legacy-fault-notification ipv6 keep is changed to ce-address-discovery keep, the stored IPv6 ce-address information is flushed. If the keep option is removed, all discovered ce-address information is flushed if the SAP is operationally down.
The ce-address stored in the Ipipe service as part of the discovery process will be updated if a new ARP arrives from the layer three device connected to the Ethernet SAP. If the layer three device connected to the Ethernet SAP does not send an ARP to indicate the addressing information has been changed, the ce-address stored locally as part of the previous discovery function will be maintained. If changes are made to the layer three device connected to the Ethernet SAP that would alter the ARP information and that device does not generate an ARP packet, or the Ipipe inter-working device does not receive the ARP packet, for example, the Ethernet SAP is admin down for IPv4, or the service is operationally down for IPv6, the stored ce-address retained by the Ipipe as a result of the keep operation will be stale. This stale information will result in a black hole for service traffic. The clear service id service-id arp can be used to flush stale ARP information. This will not solicit a arp from a peer.
The keep option will not maintain the ce-address information when the Ethernet SAP is administratively shutdown or when the node reboots.
Once all the ce-addressing has been populated in the Ipipe the legacy interfaces establishment will commence. The successful establishment of these connections will render the Ipipe service functional. Legacy connection faults and Ethernet SAP faults may now be propagated.
Should the Ethernet SAP enter a non-operational state as a result of a cable or validation protocol (ETH-CCM), the fault will be inter-worked with the specific legacy protocol. Ethernet faults will inter-work with the legacy interfaces in the following manner:
- PPP: LCP and all NCPs will be shutdown and a terminate-request sent to the far-end.
- MLPPP: LCP will remain operational but the NCP will be shutdown
- HDLC: Suspension of the keepalive messages. The keepalive interval will influence the recovery time. If the recovery timer (discussed later) is equal to the keepalive interval, recovery of the legacy interface recovery may occur after a fault is propagated toward the Ethernet network.
- Frame Relay (does not include support for the eth-legacy-fault-propagation): Signal using LMI messaging
As previously stated, inter-working faults on the legacy connection with the Ethernet infrastructure requires a Down MEP with CCM-enabled configured on the Ethernet SAP with fault-propagation enabled. There are two different methods to propagate fault from a CCM-enabled MEP; use-int-tlv or suspend-ccm. The use-int-tlv approach will cause the CCM message to include the Interface Status TLV with a value of is Down. This will raise a defMACStatus priority error on the peer MEP. The suspend-ccm approach will cause the local MEP to suspend transmissions of the CCM messages to the peer MEP. This will raise a defRemoteCCM timeout condition on the peer. The peer must accept these notifications and processes these fault conditions on the local MEP. When the MEP receives these errors, it must not include a defect condition in the CCM messages it generates that is above the peers low-priority-defect setting. In standard operation, the MEP receiving the error should only set the RDI bit in the CCM header. If the MEP improperly responds with a defect condition that is higher than the low-priority-defect of the MEP that had generated the initial fault then a deadlock condition will occur and operator intervention will be required. The two CFM propagation methods and the proper responses are shown in Figure 40.
Figure 40: Fault Propagation from Legacy to Ethernet
From a protocol (NCP) perspective, PPP and MLPPP connections have a micro view. Those connections understand the different protocols carried over the PPP and MLPPP connections, and individual protocol errors that can occur. The Ethernet SAP has a macro view without this layer three understanding. When the dual stack IPv4 and IPv6 is deployed, fault can only be propagated from the legacy connection toward the associated Ethernet SAP if both protocols fail on the PPP or MLPPP. If either of the protocols are operational then PPP or MLPPP will not propagate fault in the direction of the Ethernet connection.
Ethernet connection faults are prioritized over legacy faults. When an Ethernet fault is detected, any fault previously propagated from the PPP, MLPPP or Cisco HDLC will be squelched in favor of the higher priority Ethernet SAP failure. All legacy fault conditions, including admin port down, will in turn be dismissed for the duration of the Ethernet fault and will not be rediscovered until the expiration of the recovery-timer. This configurable timer value is the amount of time the process waits to allow the legacy connections to recover and establish following the clearing of the Ethernet fault. If the timer value is too short then false positive propagation will occur from the legacy side to the Ethernet connection. If the timer value is too long then secondary legacy faults will not be propagated to the associated Ethernet SAP for an extended period of time, delaying the proper state on the layer three device connected to the Ethernet SAP. Any packets arriving on the Ethernet SAP will be dropped until the legacy connection has recovered. As soon as the legacy connection recovers forwarding across the Ipipe will occur regardless of the amount of time remaining for the recovery timer. Operators are required to adjust this timer value to their specific network requirements. If the timer adjustment is made while the service is active, the new timer will replace the old value and the new value will start counting down when called.
If the eth-legacy-fault-notification command is disabled from an active Ipipe service then any previously reported fault will be cleared and the recovery-timer will be started. If the eth-legacy-fault-notification command is added to an active Ipipe service, the process will check for outstanding faults and take the appropriate action.
Cisco HDLC behavior must be modified in order to better align with the fault inter-working function. In order to enable the eth-legacy-fault-notification, keepalives must be enabled. The following describes the new behavior for the Cisco HDLC port:
- Operationally up if it is receiving keepalives and has physical link (same behavior in either case)
- Operationally up if keepalives are disabled locally and has physical link (irrelevant for this feature because keepalives must be enabled). This is included for completeness.
- Operationally down when no keepalives are received and keepalives are locally enabled (same behavior in either case)
- Operationally down when there is no physical port (same behavior in either case)
- Operationally Down if it is part of a SAP but there no ce-address and has physical link (altered behavior)
- Operationally Down if it is part of a SAP but the SAP is shutdown and has physical link (altered behavior)
- Operationally Down if it is part of a SAP and the service is shutdown and has physical link (altered behavior)
The show service command has been expanded to include the basic Ethernet Legacy Fault Notification information and the specific SAP configuration.
The “Eth Legacy Fault Notification” section displays the configured recovery-timer value and whether the eth-legacy-fault-notification is active “Admin State: inService” (no shutdown) or inactive “Admin State: outOfService” (shutdown).
The “Ipipe SAP Configuration Information” displays the current Ethernet fault propagated to the associated legacy connection state; “Legacy Fault Notify”: False indicates no fault is currently being propagated and True indicates fault is currently being propagated. The “Recvry Timer Rem” is used to show the amount of time remaining before the recovery timer expires. A time in seconds will only be displayed for this parameter if an Ethernet fault has cleared and the recovery timer is currently counting down to 0.0 seconds.
A number of examples have been included using the service configuration below to demonstrate the various conditions. Many of the display commands have been trimmed in an effort to present feature relevant information.
Service fully operational with no faults.
The same service is used to demonstrate an Ethernet SAP failure condition propagating fault to the associated PPP connection. In this case an ETH-CCM time out has occurred. Only the changes have been highlighted.
The log events below will be specific to the failure type and the protocols involved.
When the Ethernet fault condition clears a transitional state occurs.
An example of the legacy fault propagation to the associated Ethernet SAP and the remote peer using the ETH-CFM fault propagation, assuming no Ethernet Fault is taking precedence.
This feature is only supported for an Ipipe service that has a single legacy connection with an encap-type PPP, MLPPP or Cisco-HDLC and an Ethernet SAP. No other combinations are supported. Deployments using APS cannot use this fault propagation functionality.
The propagation of fault is based on the interaction of a number of resources and software functions. This means that propagation and recovery will vary based on the type of failure, the scale of the failure, the legacy protocol, the system overhead at the time of the action, and other interactions.
Before maintenance operations are performed the operation should be aware of the operational state of the service and any fault propagation state. Admin legacy port state down conditions do not cause fault propagation, it is the operational port state that conveys fault. During a Major ISSU operation, legacy faults will be cleared and not propagated toward the Ethernet network. In order to prevent this clearing of faults, the operator may consider shutting down the Ethernet port or shutdown the ETH-CFM MEPs to cause a timeout upstream.
| Note:
The CLI commands for these functions can be found in the L2 Services Guide. |
SAP/SDP-binding Failure (Including Pseudowire Status)
When a SAP/SDP-binding becomes faulty (oper-down, admin-down, or pseudowire status faulty), SMGR propagates the fault to OAM components on the mate SAP/SDP-binding.
Service Administratively Shutdown
When the service is administratively shutdown, SMGR propagates the fault to OAM components on both SAP/SDP-bindings.
Interaction with Pseudowire Redundancy
When the fault occurs on the SAP side, the pseudowire status bit is set for both active and standby pseudowires.
When only one of the pseudowire is faulty, SMGR does not notify CFM. The notification only occurs when both pseudowires become faulty. Then the SMGR propagates the fault to CFM. Since there is no fault handling in the PIPE service, any CFM fault detected on a SDP-binding is not used in the pseudowire redundancy’s algorithm to choose the most suitable SDP-binding to transmit on.
VPLS Service
For VPLS services, on down MEPs are supported for fault propagation.
CFM Detected Fault
When a MEP detects a fault and fault propagation is enabled for the MEP, CFM communicate the fault to the SMGR. The SMGR will mark the SAP/SDP-binding as oper-down. Note that oper-down is used here in VPLS instead of “oper-up but faulty” in the pipe services. CFM traffic can be transmitted to or received from the SAP/SDP-binding to ensure when the fault is cleared, the SAP will go back to normal operational state.
Note that as stated in CFM Connectivity Fault Conditions, a fault is raised whenever a remote MEP is down (not all remote MEPs have to be down). When it is not desirable to trigger fault handling actions in some cases when a down MEP has multiple remote MEPs, operators can disable fault propagation for the MEP.
If the MEP is a down MEP, SMGR performs the fault handling actions for the affected service(s). Local actions done by the SMGR include (but are not limited to):
- Flushing MAC addresses learned on the faulty SAP/SDP-binding.
- Triggering transmission of MAC flush messages.
- Notifying MSTP/RSTP about topology change. If the VPLS instance is a management VPLS (mVPLS), all VPLS instances that are managed by the m VPLS inherits the MSTP/RSTP state change and react accordingly to it.
- If the service instance is a B-VPLS, and fault-propagation-bmac address(es) is/are configured for the SAP/SDP-binding, SMGR performs a lookup using the BMAC address(es) to find out which pipe services need to be notified, then propagates a fault to these services. There can be up to four remote BMAC addresses associated with an SAP/SDP-binding for the same B-VPLS.
SAP/SDP-Binding Failure (Including Pseudowire Status)
If the service instance is a B-VPLS, and an associated BMAC address is configured for the failed SAP/SDP-binding, the SMGR performs a lookup using the BMAC address to find out which pipe services will be notified and then propagate fault to these services.
Within the same B-VPLS service, all SAPs/SDP-bindings configured with the same fault propagation BMACs must be faulty or oper down for the fault to be propagated to the appropriate pipe services.
Service Down
When a VPLS service is down:
- If the service is not a B-VPLS service, the SMGR propagates the fault to OAM components on all SAP/SDP-bindings in the service.
- If the service is a B-VPLS service, the SMGR propagates the fault to OAM components on all SAP/SDP-bindings in the service as well as all pipe services that are associated with the B-VPLS instance.
Pseudowire Redundancy and Spanning Tree Protocol
A SAP or SDP binding that has a down MEP fault is made operationally down. This causes pseudowire redundancy or Spanning Tree Protocol (STP) to take the appropriate actions.
However, the reverse is not true. If the SAP or SDP binding is blocked by STP, or is not tx-active due to pseudowire redundancy, no fault is generated for this entity.
IES and VPRN Services
For IES and VPRN services, only down MEP is supported on Ethernet SAPs and spoke SDP bindings.
When a down MEP detects a fault and fault propagation is enabled for the MEP, CFM communicates the fault to the SMGR. The SMGR marks the SAP/SDP binding as operationally down. CFM traffic can still be transmitted to or received from the SAP/SDP-binding to ensure when the fault is cleared and the SAP will go back to normal operational state.
Because the SAP/SDP-binding goes down, it is not usable to upper applications. In this case, the IP interface on the SAP/SDP-binding go down. The prefix is withdrawn from routing updates to the remote PEs. The same applies to subscriber group interface SAPs on the 7450 ESS and 7750 SR.
When the IP interface is administratively shutdown, the SMGR notifies the down MEP and a CFM fault notification is generated to the CPE through interface status TLV or suspension of CCM based on local configuration.
Pseudowire Switching
When the node acts as a pseudowire switching node, meaning two pseudowires are stitched together at the node, the SMGR will not communicate pseudowire failures to CFM. Such features are expected to be communicated by pseudowire status messages, and CFM will run end-to-end on the head-end and tail-end of the stitched pseudowire for failure notification.
LLF and CFM Fault Propagation
LLF and CFM fault propagation are mutually exclusive. CLI protection is in place to prevent enabling both LLF and CFM fault propagation in the same service, on the same node and at the same time. However, there are still instances where irresolvable fault loops can occur when the two schemes are deployed within the same service on different nodes. This is not preventable by the CLI. At no time should these two fault propagation schemes be enabled within the same service.
802.3ah EFM OAM Mapping and Interaction with Service Manager
802.3ah EFM OAM declares a link fault when any of the following occurs:
- Loss of OAMPDU for a certain period of time
- Receiving OAMPDU with link fault flags from the peer
When 802.3ah EFM OAM declares a fault, the port goes into operation state down. The SMGR communicates the fault to CFM MEPs in the service.
OAM fault propagation in the opposite direction (SMGR to EFM OAM) is not supported.
Service Assurance Agent (SAA)
Service Application Agent (SAA) is a tool that allows operators to configure a number of different tests that can be used to provide performance information like delay, jitter and loss for services or network segments. The test results are saved in SNMP tables or summarized XML files. These results can be collected and reported on using network management systems.
SAA uses the resources allocated to the various OAM processes. These processes are not dedicated to SAA but shared throughout the system. Table 7 provides guidance on how these different OAM functions are logically grouped.
Table 7: SAA Test and Descriptions
Test | Description |
Background | Tasks configured outside of the SAA hierarchy that consume OAM task resources. Specifically, these include SDP-Keep Alive, Static route cpe-check, filter redirect-policy, ping-test, and vrrp policy host-unreachable. These are critical tasks that ensure the network operation and may affect data forwarding or network convergence. |
SAA Continuous | SAA tests configured as continuous (always scheduled). |
SAA non-continuous | SAA tests that are not configured as continuous, hence scheduled outside of the SAA application. These tests require the oam saa test-name start command to initiate the test run. |
Non-SAA (Directed) | Any task that does not include any configuration under SAA. These tests are SNMP or via the CLI that is used to troubleshoot or profile network condition. This would take the form “oam test-type” or ping/traceroute with the specific test parameters. |
SAA test types are restricted to those that utilize a request response mechanism, single-ended tests. Dual-ended tests that initiate the test on one node but require the statistical gathering on the other node are not supported under SAA. As an example, Y.1731 defines two approaches for measuring frame delay and frame delay variation, single-ended and dual-ended. The single-ended approach is supported under SAA.
Post processing analysis of individual test runs can be used to determine the success or failure of the individual runs. The operator can set rising and lowering thresholds for delay, jitter, and loss. Exceeding the threshold will cause the test to have a failed result. A trap can be generated when the test fails. The operator is also able to configure a probe failure threshold and trap when these thresholds are exceeded.
Each supported test type has configuration properties specific to that test. Not all options, intervals, and parameters are available for all tests. Some configuration parameters, such as the sub second probe interval require specific hardware platforms.
The ETH-CFM SAA and icmp-ping (without the rapid parameter) test types may be configured as continuous, meaning always scheduled. When a test is executing the probe, spacing is based on the interval parameter, assuming there are no lost packets. In general, trace type tests apply the timeout to each individual packet. This is required because packet timeout may be required to move from one probe to the next probe. For tests that do not require this type of behavior, typically ping and ETH-CFM PM functions, the probes will be sent at the specified probe interval and the timeout is only applied at the end of the test if any probe has been lost during the run. When the timeout is applied at the end of the run, the test is considered complete when either all response have been received or the timeout expires at the end of the test run. For tests marked as continuous (always scheduled), the spacing between the runs may be delayed by the timeout value when a packet is lost. The test run is complete when all probes have either been received back or the timeout value has expired.
In order to preserve system resources, specifically memory, the operator should only store summarized history results. By default, summary results are stored for tests configured with sub second probe intervals, or a probe count above 100 or is written to a file. By default, per probe information will be stored for test configured with an interval of one second or above counters, and probe counts of 100 or less and is not written to a file. The operator may choose to override these defaults using the probe-history {keep | drop | auto} option. The auto option sets the defaults above. The other options override the default retention schemes based on the operator requirements, per probe retention keep or summary only information drop. The probe data can be viewed using the show saa test command. If the per probe information is retained, this probe data is available at the completion of the test run. The summary data is updated throughout the test run. The overall memory system usage is available using the show system memory-pools command. The OAM entry represents the overall memory usage. This includes the history data stored for SAA tests. A clear saa testname option is available to release the memory and flush the test results.
The following example shows Y.1731 ETH-DMM packets to be sent from the local MEP 325, domain 12 and association 300 to destination MAC address d0:0d:1e:00:00:27. The tests will be scheduled as continuous and do not require an oam saa test-name start command to be issued by the operator. Each individual test run will contain 900 probes at 1 second intervals. This means each individual test run will be active for 15 minutes. If a packet is lost, the test will wait for the timeout (default 5s not shown) before closing one run and move to the next. If more than 10 probes are lost, the test will be marked as failed and a trap and log entry will be generated.
Test summary information and not per probe data is maintained for this test because the optional probe-history override is not configured. The summary information will be written to an XML file using the accounting-policy 1.
Example:
SAA leverages the accounting record infrastructure. The sample configuration is included for completeness. For complete information on Accounting Policies consult the System Management Guide.
SAA launched tests will maintain two most recent completed and one in progress test. The output below is the summary data from the test above. Below, test run 18 and 19 have been completed and test run 20 is in progress. Once test run 20 is completed test run 18 data will be overwritten. It is important to ensure that the collection and accounting record process is configured in such a way to write the data to file before it is overwritten. Once the results are overwritten they are lost.
Any data not written to file will be lost on a CPU switch over.
There are a number of show commands to help the operator monitor the test oam tool set.
show test-oam oam-config-summary —Provides information about the configured tests.
show test-oam oam-perf — Provides the transmit (launched form me) rate information and remotely launched test receive rate on the local network element.
clear test-oam oam-perf — Provides the ability to clear the test oam performance stats for a current view of the different rates in the oam-perf command above.
monitor test-oam oam-perf — Makes use of the monitor command to provide time sliced performance stats for test oam functions.
OAM Performance Monitoring (OAM-PM)
OAM Performance Monitoring (OAM-PM) provides an overall architecture for gathering and computing key performance indicators (KPI) using standard protocols and a robust collection model. The architecture is comprised of a number of foundational components.
- Session: This is the overall collection of different tests, test parameters, measurement intervals, and mapping to configured storage models. It is the overall container that defines the attributes of the session.
- Standard PM Packets: The protocols defined by various standards bodies that contains the necessary fields to collect statistical data for the performance attribute they represent. OAM-PM leverages single ended protocols. Single ended protocols follow a message response model, message sent by a launch point, response updated, and reflected by a responder.
- Measurement Intervals (MI): Time based non-overlapping windows that captures all the results that are received in that window of time.
- Data Structures: The unique counters and measurement results that represent the specific protocol.
- Bin group: Ranges in micro seconds that counts the results that fit into the range.
The hierarchy of the architecture is captured in the Figure 41. This diagram is only meant to draw the relationship between the components. It is not meant to depict all the detailed parameters required
Figure 41: OAM-PM Architecture Hierarchy
OAM-PM configurations are not dynamic environments. All aspects of the architecture must be carefully considered before configuring the various architectural components, making external references to other related components or activating the OAM-PM architecture. No modifications are allowed to any components that are active or have any active sub components. Any function being referenced by an active OAM-PM function or test cannot be modified or have its state shutdown. For example, to change any configuration element of a session all active tests must be in a shutdown state. To change any bin group configuration (described later in this section) all sessions that reference the bin group must have every test shutdown. The description parameter is the only exception to this rule.
Session sources and destinations configuration parameters are not validated by the test that makes uses of that information. Once the test is activated with a no shutdown, the test engine will attempt to send the test packets even if the session source and destination information does not accurately represent the entity that must exist to successfully transmit or terminate the packets. If the session is a MEP-based Ethernet session and the source-based MEP does not exist, the transmit count for the test will be zero. If the source-based session is TWAMP Light, the OAM-PM transmit counter will increment but the receive counter will not.
OAM-PM is not a hitless operation. If a high availability event occurs, causing the backup CPM to become the newly active or when ISSU functions are performed. Tests in flight will not be completed, open files may not be closed, and test data not written to a properly closed XML file will be lost. There is no synchronization of state between the active and the backup control modules. All OAM-PM statistics stored in volatile memory will be lost. Once the reload or high availability event is completed and all services are operational then the OAM-PM functions will commence.
It is possible that during times of network convergence, high CPU utilizations or contention for resources, OAM-PM may not be able to detect changes to an egress connection or allocate the necessary resources to perform its tasks.
This section describes the following topics:
Session
This is the overall collection of different tests, the test parameters, measurement intervals, and mapping to configured storage models. It is the overall container that defines the attributes of the session.
Session Type: Assigns the mantra of the test to either proactive (default) or on-demand. Individual test timing parameters will be influenced by this setting. A proactive session will start immediately following the no shutdown of the test. A proactive test will continue to execute until a manual shutdown stops the individual test. On-demand tests do not start immediately following the no shutdown command. The operator must start an on-demand test by using the command oam>oam-pm>session>start and specifying the applicable protocol. The operator can override the no test-duration default by configuring a fixed amount of time the test will execute, up to 24 hours (86400 seconds). If an on-demand test is configured with a test-duration, it is important to shut down and delete the tests when they are completed and all the results collected. This will free all system memory that has been reserved for storing the results. In the event of a high-availability event that causes the backup CPM to become the newly active, all on-demand tests will need to be restarted manually using the oam>oam-pm>session>start command for the specific protocol.
Test Family: The main branch of testing that will be addressed a specific technology. The available test parameters for the session will be based off the test family. The destination, source, and the priority are common to all tests under the session and defined separately from the individual test parameters.
Test Parameters: The parameters include individual tests with the associated parameters including start and stop times and the ability to activate and deactivate the individual test.
Measurement Interval: Assignment of collection windows to the session with the appropriate configuration parameters and accounting policy for that specific session.
The “Session” can be viewed as the single container that brings all aspects of individual tests and the various OAM-PM components under a single umbrella. If any aspects of the session are incomplete, the individual test may fail to be activated with a no shutdown command. If this situation occurs an error, it will indicate with “Invalid session parameters”.
Standard PM Packets
A number of standards bodies define performance monitoring packets that can be sent from a source, processed, and responded to by a reflector. The protocol may be solely focused on measuring a single specific performance criteria or multiple. The protocols available to carry out the measurements will be based on the test family type configured for the session.
Ethernet PM delay measurements are carried out using the Two Way Delay Measurement Protocol version 1 (DMMv1) defined in Y.1731 by the ITU-T. This allows for the collection of Frame Delay (FD), InterFrame Delay Variation (IFDV), Frame Delay Range (FDR) and Mean Frame Delay (MFD) measurements, round trip, forward, and backward.
DMMv1 adds the following to the original DMM definition:
- Flag Field (1 bit – LSB) is defined as the Type (Proactive=1 | On-Demand=0)
- TestID TLV (32 bits) – Carried in the Optional TLV portion of the PDU
DMMv1 and DMM are backwards compatible and the interaction is defined in Y.1731 ITU-T-2011 Section 11 “OAM PDU validation and versioning.”
Ethernet PM loss measurements are carried out using the Synthetic Loss Measurement (SLM) defined in Y.1731 by the ITU-T. This allows for the calculation of Frame Loss Ratio (FLR) and availability. The ITU-T also defines a frame loss measurement (LMM) approach that provides frame loss ratio (FLR) and raw transmit and receive frame counters in each direction and availability metrics.
IP Performance data uses the TWAMP test packet for gathering both delay and loss metrics. OAM-PM supports Appendix I of RFC 5357 (TWAMP Light). The SR OS supports the gathering of delay metrics Frame Delay (FD), InterFrame Delay Variation (IFDV), Frame Delay Range (FDR) and Mean Frame Delay (MFD) round trip, forward and backward.
A session can be configured with one test or multiple tests. Depending on sessions test type family, one or more test configurations may need to be included in the session to gather both delay and loss performance information. Each test that is configured within a session will share the common session parameters and common measurement intervals. However, each test can be configured with unique per test parameters. Using Ethernet as an example, both DMM and SLM would be required to capture both delay and loss performance data. IP performance measurement uses a single TWAMP packet for both delay and synthetic loss.
Each test must be configured with a TestID as part of the test parameters. This uniquely identifies the test within the specific protocol. A TestID must be unique within the same test protocol. Again using Ethernet as an example, DMM and SLM tests within the same session can use the same TestID because they are different protocols. However, if a TestID is applied to a test protocol (like DMM or SLM) in any session, it cannot be used for the same protocol in any other session. When a TestID is carried in the protocol, as it is with DMM and SLM, this value does not have global significance. When a responding entity must index for the purpose of maintaining sequence numbers, as in the case of SLM, the tupple TestID, Source MAC, and Destination MAC are used to maintain the uniqueness on the responder. This means the TestID has only local and not global significance. TWAMP test packets also require a TestID to be configured but do not carry this information in the PDU. However, it is required for uniform provisioning under the OAM-PM architecture. TWAMP uses a four tuple Source IP, Destination IP, Source UDP, and Destination UDP to maintain unique session indexes.
Detectable Transmit Errors
Each OAM-PM session test contains both an administrative and an operational state. The administrative state is linked to the shutdown or no shutdown configuration for the test. The operational state indicates if the test is actively sending or trying to send test frames. For all proactive session types, the administrative and operational states are linked. The test immediately starts and attempts to send test frames as soon as the no shutdown command is accepted. Sessions configured using the session-type on-demand command do not link the two states. The operational state is up when the test is actively generating or attempting to generate test frames. This does not occur at the time the no shutdown command is accepted. The oam oam-pm ... start command is required to commence the transmission of the test frames for on-demand tests. When the manually issued start command is accepted, the operational state changes to up. At the expiration of the test duration, or when the test is manually stopped using the oam oam-pm ... stop command, the operational state transitions to down.
A new field, “Detectable Tx Err”, has been added to each Ethernet and IP OAM-PM test to indicate if there is a detectable transmit error that is preventing the test frames from being sent. This does not affect the two existing states. Detectable Tx Err information can be used to assist in troubleshooting, as it conveys information about a current detectable error state. No log events are created and no historical references are maintained when the error condition clears or changes.
The Detectable Tx Err condition is checked for each test which is operationally up and attempting to send frames. The audit function checks to see if a transmit error condition exists that could prevent the packet from being sent; for example, the source MEP is not fully configured, or the IP interface associated with the source is down. A raised detectable transmit error is cleared for the test if the audit process executes and finds no further detectable transmit error conditions. The interval of the audit function depends on a number of factors, such as the test family, the probe interval, and the number of active tests.
This is an ongoing maintenance function that executes while the test is operationally up. A maximum of one detectable transmit error can be presented to the operator. However, more underlying conditions may be detected should the existing condition be cleared.
When a test’s operational state is anything other than up, the detection process will stop and any Detectable Tx Error fields will display a value of “none”. History is not maintained for detectable transmit errors.
Not all errors are detectable. This function is only meant to guide the operator to a potential area of concern. There is a very large dependency on the direction of the MEP, the service type, the test protocol, and resource requirements that the test maintains over the underlying entity; any of these can influence the reporting of certain errors. Tests requiring the resources of an Up MEP, for example, will typically only report the conditions relating to incomplete configuration or the administrative state of the MEP. Up MEPs ignore the presence of egress connections and service states. However, LMM tests will report an unexpected error condition when the Up MEP SDP binding is down because it explicitly requires resources from the non-operational SDP binding. The same cannot be said if an LMM test was executing from an Up MEP configured over a non-operational SAP.
The TIMETRA-OAM-PM-MIB TEXTUAL-CONVENTION TmnxOamPmDetectableTxError MIB lists all possible detectable error conditions.
The show oam-pm session session-name command provides a detailed view of the session, including each test and the Detectable Tx Err field for those tests.
The show oam-pm sessions detectable-tx-errors command lists all sessions that include a test with a detectable transmit error and the associated error.
Measurement Intervals
A measurement interval is a window of time that compartmentalizes the gathered measurements for an individual test that has occurred during that time. Allocation of measurement intervals, which equates to system memory, is based on the metrics being collected. This means that when both delay and loss metrics are being collected, they allocate their own set of measurement intervals. If the operator is executing multiple delay and loss tests under a single session then multiple measurement intervals will be allocated one per criteria per test.
Measurement intervals can be 5 minutes (5-mins), 15 minutes (15-min), one hour (1-hour), and 1 day (1-day) in duration. The boundary-type defines the start of the measurement interval and can be aligned to the local time of day clock (wall clock), with or without an optional offset. The boundary-type can be test-aligned, which means the start of the measurement interval coincides with the no shutdown of the test, for proactive tests. By default the start boundary is clocked aligned without an offset. When this configuration is deployed, the measurement interval will start at zero, in relation to the length. When a boundary is clock aligned and an offset is configured, that amount of time will be applied to the measurement interval. Offsets are configured on a per measurement interval basis and only applicable to clock-aligned and not test aligned measurement intervals. Only offsets less than the measurement interval duration are be allowed. Table 8 provides some examples of the start times of each measurement interval.
Table 8: Measurement Intervals Start Time
Offset | 5-min | 15-min | 1-hour | 1-day |
0 (default) | 00,5,10,15..55 | 00,15,30,45 | 00 (top of the hour) | midnight |
10 minutes | rejected | 10,25,40,55 | 10 min after the hour | 10 minutes after midnight |
30 minutes | rejected | rejected | 30 minutes after the hour | 30 minutes after midnight |
60 minutes | rejected | rejected | rejected | 01:00am |
Although test aligned approaches may seem beneficial for simplicity, there are some drawbacks that need to be considered. The goal of time based and well defined collection windows allows for the comparison of measurements across common windows of time throughout the network and for relating different tests or sessions. It is suggested that proactive sessions use the default clock-aligned boundary type. On-demand sessions may make use of test-aligned boundaries. On-demand tests are typically used for troubleshooting or short term monitoring that does not require alignment or comparison to other PM data.
The statistical data collected and the computed results from each measurement interval will be maintained in volatile system memory by default. The number of intervals-stored is configurable per measurement interval. Different measurement interval lengths will have different defaults and ranges. The interval-stored parameter defines the number of completed individual test runs to store in volatile memory. There is an additional allocation to account for the active measurement interval. In order to look at the statistical information for the individual tests and a specific measurement interval stored in volatile memory, the show oam-pm statistics … interval-number can be used. If there is an active test, it can be viewed using the interval-number 1. In this case, the first completed record would be 2, previously completed would number back to the maximum intervals stored value plus one.
As new tests for the measurement interval complete, the older entries will get renumbered to maintain their relative position to the current test. As the retained test data for a measurement interval consumes the final entry, any subsequent entries will cause the removal of the oldest data.
There are obvious drawbacks to this storage model. Any high availability function that causes an active CPM switch will flush the results that were in volatile memory. Another consideration is the large amount of system memory consumed using this type of model. Given the risks and resource consumption this model incurs, an alternate method of storage is supported. An accounting policy can be applied to each measurement interval in order write the completed data in system memory to non-volatile flash in an XML format. The amount of system memory consumed by historically completed test data must be balanced with an appropriate accounting policy. It is recommended that the only necessary data be stored in non-volatile memory to avoid unacceptable risk and unnecessary resource consumption. It is also suggested that a large overlap between the data written to flash and stored in volatile memory is unnecessary.
The statistical information is system memory is also available by SNMP. If this method is chosen then a balance must be struck between the intervals retained and the times at which the SNMP queries collect the data. One must be cautious when determining the collection times through SNMP. If a file completes while another file is being retrieved through SNMP then the indexing will change to maintain the relative position to the current run. Proper spacing of the collection is key to ensuring data integrity.
The OAM-PM XML File contains the following keywords and MIB references.
Table 9: OAM-PM XML Keywords and MIB Reference
XML File Keyword | Description | TIMETRA-OAM-PM-MIB Object |
oampm | — | None - header only |
Keywords Shared by all OAM-PM Protocols | ||
sna | OAM-PM session name | tmnxOamPmCfgSessName |
mi | Measurement Interval record | None - header only |
dur | Measurement Interval duration (minutes) | tmnxOamPmCfgMeasIntvlDuration (enumerated) |
ivl | measurement interval number | tmnxOamPmStsIntvlNum |
sta | Start timestamp | tmnxOamPmStsBaseStartTime |
ela | Elapsed time in seconds | tmnxOamPmStsBaseElapsedTime |
ftx | Frames sent | tmnxOamPmStsBaseTestFramesTx |
frx | Frames received | tmnxOamPmStsBaseTestFramesRx |
sus | Suspect flag | tmnxOamPmStsBaseSuspect |
dmm | Delay Record | None - header only |
mdr | minimum frame delay, round-trip | tmnxOamPmStsDelayDmm2wyMin |
xdr | maximum frame delay, round-trip | tmnxOamPmStsDelayDmm2wyMax |
adr | average frame delay, round-trip | tmnxOamPmStsDelayDmm2wyAvg |
mdf | minimum frame delay, forward | tmnxOamPmStsDelayDmmFwdMin |
xdf | maximum frame delay, forward | tmnxOamPmStsDelayDmmFwdMax |
adf | average frame delay, forward | tmnxOamPmStsDelayDmmFwdAvg |
mdb | minimum frame delay, backward | tmnxOamPmStsDelayDmmBwdMin |
xdb | maximum frame delay, backward | tmnxOamPmStsDelayDmmBwdMax |
adb | average frame delay, backward | tmnxOamPmStsDelayDmmBwdAvg |
mvr | minimum inter-frame delay variation, round-trip | tmnxOamPmStsDelayDmm2wyMin |
xvr | maximum inter-frame delay variation, round-trip | tmnxOamPmStsDelayDmm2wyMax |
avr | average inter-frame delay variation, round-trip | tmnxOamPmStsDelayDmm2wyAvg |
mvf | minimum inter-frame delay variation, forward | tmnxOamPmStsDelayDmmFwdMin |
xvf | maximum inter-frame delay variation, forward | tmnxOamPmStsDelayDmmFwdMax |
avf | average inter-frame delay variation, forward | tmnxOamPmStsDelayDmmFwdAvg |
mvb | minimum inter-frame delay variation, backward | tmnxOamPmStsDelayDmmBwdMin |
xvb | maximum inter-frame delay variation, backward | tmnxOamPmStsDelayDmmBwdMax |
avb | average inter-frame delay variation, backward | tmnxOamPmStsDelayDmmBwdAvg |
mrr | minimum frame delay range, round-trip | tmnxOamPmStsDelayDmm2wyMin |
xrr | maximum frame delay range, round-trip | tmnxOamPmStsDelayDmm2wyMax |
arr | average frame delay range, round-trip | tmnxOamPmStsDelayDmm2wyAvg |
mrf | minimum frame delay range, forward | tmnxOamPmStsDelayDmmFwdMin |
xrf | maximum frame delay range, forward | tmnxOamPmStsDelayDmmFwdMax |
arf | average frame delay range, forward | tmnxOamPmStsDelayDmmFwdAvg |
mrb | minimum frame delay range, backward | tmnxOamPmStsDelayDmmBwdMin |
xrb | maximum frame delay range, backward | tmnxOamPmStsDelayDmmBwdMax |
arb | average frame delay range, backward | tmnxOamPmStsDelayDmmBwdAvg |
fdr | frame delay bin record, round-trip | None - header only |
fdf | frame delay bin record, forward | None - header only |
fdb | frame delay bin record, backward | None - header only |
fvr | inter-frame delay variation bin record, round-trip | None - header only |
fvf | inter-frame delay variation bin record, forward | None - header only |
fvb | inter-frame delay variation bin record, backward | None - header only |
frr | frame delay range bin record, round-trip | None - header only |
frf | frame delay range bin record, forward | None - header only |
frb | frame delay range bin record, backward | None - header only |
lbo | Configured lower bound of the bin | tmnxOamPmCfgBinLowerBound |
cnt | Number of measurements within the configured delay range. Note that the session_name, interval_duration, interval_number, {fd, fdr, ifdv}, bin_number, and {forward, backward, round-trip} indices are all provided by the surrounding XML context. | tmnxOamPmStsDelayDmmBinFwdCount tmnxOamPmStsDelayDmmBinBwdCount tmnxOamPmStsDelayDmmBin2wyCount |
slm | Synthetic Loss Measurement Record | None - header only |
txf | Transmitted frames in the forward direction | tmnxOamPmStsLossSlmTxFwd |
rxf | Received frames in the forward direction | tmnxOamPmStsLossSlmRxFwd |
txb | Transmitted frames in the backward direction | tmnxOamPmStsLossSlmTxBwd |
rxb | Received frames in the backward direction | tmnxOamPmStsLossSlmRxBwd |
avf | Available count in the forward direction | tmnxOamPmStsLossSlmAvailIndFwd |
avb | Available count in the backward direction | tmnxOamPmStsLossSlmAvailIndBwd |
uvf | Unavailable count in the forward direction | tmnxOamPmStsLossSlmUnavlIndFwd |
uvb | Unavailable count in the backward direction | tmnxOamPmStsLossSlmUnavlIndBwd |
uaf | Undetermined available count in the forward direction | tmnxOamPmStsLossSlmUndtAvlFwd |
uab | Undetermined available count in the backward direction | tmnxOamPmStsLossSlmUndtAvlBwd |
uuf | Undetermined unavailable count in the forward direction | tmnxOamPmStsLossSlmUndtUnavlFwd |
uub | Undetermined unavailable count in the backward direction | tmnxOamPmStsLossSlmUndtUnavlBwd |
hlf | Count of HLIs in the forward direction | tmnxOamPmStsLossSlmHliFwd |
hlb | Count of HLIs in the backward direction | tmnxOamPmStsLossSlmHliBwd |
chf | Count of CHLIs in the forward direction | tmnxOamPmStsLossSlmChliFwd |
chb | Count of CHLIs in the backward direction | tmnxOamPmStsLossSlmChliBwd |
mff | minimum FLR in the forward direction | tmnxOamPmStsLossSlmMinFlrFwd |
xff | maximum FLR in the forward direction | tmnxOamPmStsLossSlmMaxFlrFwd |
aff | average FLR in the forward direction | tmnxOamPmStsLossSlmAvgFlrFwd |
mfb | minimum FLR in the backward direction | tmnxOamPmStsLossSlmMinFlrBwd |
xfb | maximum FLR in the backward direction | tmnxOamPmStsLossSlmMaxFlrBwd |
afb | average FLR in the backward direction | tmnxOamPmStsLossSlmAvgFlrBwd |
lmm | Frame Loss Measurement Record | None - header only |
txf | Transmitted frames in the forward direction | tmnxOamPmStsLossLmmTxFwd |
rxf | Received frames in the forward direction | tmnxOamPmStsLossLmmRxFwd |
txb | Transmitted frames in the backward direction | tmnxOamPmStsLossLmmTxBwd |
rxb | Received frames in the backward direction | tmnxOamPmStsLossLmmRxBwd |
mff | minimum FLR in the forward direction | tmnxOamPmStsLossLmmMinFlrFwd |
xff | maximum FLR in the forward direction | tmnxOamPmStsLossLmmMaxFlrFwd |
aff | average FLR in the forward direction | tmnxOamPmStsLossLmmAvgFlrFwd |
mfb | minimum FLR in the backward direction | tmnxOamPmStsLossLmmMinFlrBwd |
xfb | maximum FLR in the backward direction | tmnxOamPmStsLossLmmMaxFlrBwd |
afb | average FLR in the backward direction | tmnxOamPmStsLossLmmAvgFlrBwd |
ave | lmm availability enabled/disabled | No TIMETRA-OAM-PM-MIB entry |
avf | available count in the forward direction | tmnxOamPmStsLossLmmAvailIndFwd |
avb | available count in the backward direction | tmnxOamPmStsLossLmmAvailIndBwd |
uvf | unavailable count in the forward direction | tmnxOamPmStsLossLmmUnavlIndFwd |
uvb | unavailable count in the backward direction | tmnxOamPmStsLossLmmUnavlIndBwd |
uaf | undetermined available count in the forward direction | tmnxOamPmStsLossLmmUndtAvlFwd |
uab | undetermined available count in the backward direction | tmnxOamPmStsLossLmmUndtAvlBwd |
uuf | undetermined unavailable count in the forward direction | tmnxOamPmStsLossLmmUndtUnavlFwd |
uub | undetermined unavailable count in the backward direction | tmnxOamPmStsLossLmmUndtUnavlBwd |
hlf | count of HLIs in the forward direction | tmnxOamPmStsLossLmmHliFwd |
hlb | count of HLIs in the backward direction | tmnxOamPmStsLossLmmHliBwd |
chf | count of CHLIs in the forward direction | tmnxOamPmStsLossLmmChliFwd |
chb | count of CHLIs in the backward direction | tmnxOamPmStsLossLmmChliBwd |
udf | undetermined delta-t in the forward direction | tmnxOamPmStsLossLmmUndetDelTsFwd |
udb | undetermined delta-t in the backward direction | tmnxOamPmStsLossLmmUndetDelTsBwd |
TLD | TWAMP Light Delay Record | None - header only |
mdr | minimum frame delay, round-trip | tmnxOamPmStsDelayTwl2wyMin |
xdr | maximum frame delay, round-trip | tmnxOamPmStsDelayTwl2wyMax |
adr | average frame delay, round-trip | tmnxOamPmStsDelayTwl2wyAvg |
mdf | minimum frame delay, forward | tmnxOamPmStsDelayTwlFwdMin |
xdf | maximum frame delay, forward | tmnxOamPmStsDelayTwlFwdMax |
adf | average frame delay, forward | tmnxOamPmStsDelayTwlFwdAvg |
mdb | minimum frame delay, backward | tmnxOamPmStsDelayTwlBwdMin |
xdb | maximum frame delay, backward | tmnxOamPmStsDelayTwlBwdMax |
adb | average frame delay, backward | tmnxOamPmStsDelayTwlBwdAvg |
mvr | minimum inter-frame delay variation, round-trip | tmnxOamPmStsDelayTwl2wyMin |
xvr | maximum inter-frame delay variation, round-trip | tmnxOamPmStsDelayTwl2wyMax |
avr | average inter-frame delay variation, round-trip | tmnxOamPmStsDelayTwl2wyAvg |
mvf | minimum inter-frame delay variation, forward | tmnxOamPmStsDelayTwlFwdMin |
xvf | maximum inter-frame delay variation, forward | tmnxOamPmStsDelayTwlFwdMax |
avf | average inter-frame delay variation, forward | tmnxOamPmStsDelayTwlFwdAvg |
mvb | minimum inter-frame delay variation, backward | tmnxOamPmStsDelayTwlBwdMin |
xvb | maximum inter-frame delay variation, backward | tmnxOamPmStsDelayTwlBwdMax |
avb | average inter-frame delay variation, backward | tmnxOamPmStsDelayTwlBwdAvg |
mrr | minimum frame delay range, round-trip | tmnxOamPmStsDelayTwl2wyMin |
xrr | maximum frame delay range, round-trip | tmnxOamPmStsDelayTwl2wyMax |
arr | average frame delay range, round-trip | tmnxOamPmStsDelayTwl2wyAvg |
mrf | minimum frame delay range, forward | tmnxOamPmStsDelayTwlFwdMin |
xrf | maximum frame delay range, forward | tmnxOamPmStsDelayTwlFwdMax |
arf | average frame delay range, forward | tmnxOamPmStsDelayTwlFwdAvg |
mrb | minimum frame delay range, backward | tmnxOamPmStsDelayTwlBwdMin |
xrb | maximum frame delay range, backward | tmnxOamPmStsDelayTwlBwdMax |
arb | average frame delay range, backward | tmnxOamPmStsDelayTwlBwdAvg |
fdr | frame delay bin record, round-trip | None - header only |
fdf | frame delay bin record, forward | None - header only |
fdb | frame delay bin record, backward | None - header only |
fvr | inter-frame delay variation bin record, round-trip | None - header only |
fvf | inter-frame delay variation bin record, forward | None - header only |
fvb | inter-frame delay variation bin record, backward | None - header only |
frr | frame delay range bin record, round-trip | None - header only |
frf | frame delay range bin record, forward | None - header only |
frb | frame delay range bin record, backward | None - header only |
lbo | Configured lower bound of the bin | tmnxOamPmCfgBinLowerBound |
cnt | Number of measurements within the configured delay range. Note that the session_name, interval_duration, interval_number, {fd, fdr, ifdv}, bin_number, and {forward, backward, round-trip} indices are all provided by the surrounding XML context. | tmnxOamPmStsDelayTwlBinFwdCount tmnxOamPmStsDelayTwlBinBwdCount tmnxOamPmStsDelayTwlBin2wyCount |
TLL | TWAMP Light Loss Record | None - header only |
slm | Synthetic Loss Measurement Record | None - header only |
txf | Transmitted frames in the forward direction | tmnxOamPmStsLossTwlTxFwd |
rxf | Received frames in the forward direction | tmnxOamPmStsLossTwlRxFwd |
txb | Transmitted frames in the backward direction | tmnxOamPmStsLossTwlTxBwd |
rxb | Received frames in the backward direction | tmnxOamPmStsLossTwlRxBwd |
avf | Available count in the forward direction | tmnxOamPmStsLossTwlAvailIndFwd |
avb | Available count in the backward direction | tmnxOamPmStsLossTwlAvailIndBwd |
uvf | Unavailable count in the forward direction | tmnxOamPmStsLossTwlUnavlIndFwd |
uvb | Unavailable count in the backward direction | tmnxOamPmStsLossTwlUnavlIndBwd |
uaf | Undetermined available count in the forward direction | tmnxOamPmStsLossTwlUndtAvlFwd |
uab | Undetermined available count in the backward direction | tmnxOamPmStsLossTwlUndtAvlBwd |
uuf | Undetermined unavailable count in the forward direction | tmnxOamPmStsLossTwlUndtUnavlFwd |
uub | Undetermined unavailable count in the backward direction | tmnxOamPmStsLossTwlUndtUnavlBwd |
hlf | Count of HLIs in the forward direction | tmnxOamPmStsLossTwlHliFwd |
hlb | Count of HLIs in the backward direction | tmnxOamPmStsLossTwlHliBwd |
chf | Count of CHLIs in the forward direction | tmnxOamPmStsLossTwlChliFwd |
chb | Count of CHLIs in the backward direction | tmnxOamPmStsLossTwlChliBwd |
mff | minimum FLR in the forward direction | tmnxOamPmStsLossTwlMinFlrFwd |
xff | maximum FLR in the forward direction | tmnxOamPmStsLossTwlMaxFlrFwd |
aff | average FLR in the forward direction | tmnxOamPmStsLossTwlAvgFlrFwd |
mfb | minimum FLR in the backward direction | tmnxOamPmStsLossTwlMinFlrBwd |
xfb | maximum FLR in the backward direction | tmnxOamPmStsLossTwlMaxFlrBwd |
afb | average FLR in the backward direction | tmnxOamPmStsLossTwlAvgFlrBwd |
By default, 5-mins measurement interval will store 33 test runs (32+1) with a configurable range of [1 to 96]. By default, 15-mins measurement interval will store 33 test runs (32+1) with a configurable range of [1 to 96]. The 5-mins and 15-mins measurement intervals share the [1 to 96] pool up to a maximum of 96. In the unlikely case where both the 5-mins and 15-mins measurement intervals are configured for the same oam-pm session, the total combined intervals stored cannot exceed 96. By default, 1-hour measurement intervals will store 9 test runs (8+1) with a configurable range of [1 to 24]. The only storage for the 1-day measurement interval is 2 (1+1). When the 1-day measurement interval is configured, this is the only value for intervals. The value cannot be changed.
All four measurement intervals may included for a single session if required. Each measurement interval that is included in a session will be updated simultaneously for each test that is being executed. If a measurement interval duration is not required, it should not be configured. In addition to the four predefined lengths, a fifth measurement interval is always on and is allocated at test creation, the “raw” measurement interval. It is a valuable tool for assisting in real time troubleshooting as it maintains the same performance information and relates to the same bins as the fixed length collection windows. The operator may clear the contents of the raw measurement interval in order to flush stale statistical data in order to look at current conditions. This measurement interval has no configuration options, and it cannot be written to flash and cannot be disabled. It is a single never ending collection window.
Memory allocation for the measurement intervals is performed when the test transitions from an operationally down state to an operationally up state. Any previous stored test data will be cleared from volatile memory in favor of the new allocation. This will result in the loss of all data that has not been written to the XML file or collected by some other means. Volatile memory will be flushed and completely released when the test is deleted from the configuration, or a high availability event causes the backup CPM to become the newly active CPM, or some other event clears the active CPM system memory. Following an HA event, memory reallocation occurs when the operational state of the test changes from down to up. Shutting down a test does not release the allocated memory for the test.
Measurement intervals also include a suspect flag. The suspect flag is used to indicate that data collected in the measurement interval may not be representative. The flag will be set to true only under the following conditions;
- Time-of Day clock is adjusted by more than 10 seconds.
- Test start does not align with the start boundary of the measurement interval. This would be common for the first execution for clock aligned tests.
- Test stopped before the end of the measurement interval boundary.
The suspect flag is not set to true when there are times of service disruption, maintenance windows, discontinuity, low packet counts, or other such type events. Higher level systems would be required to interpret and correlate those types of event for measurement intervals that are executed during the time that relate to the specific interruption or condition. Since each measurement interval contains a start and stop time, the information is readily available to those higher level system to discount the specific windows of time.
Data Structures and Storage
There are two main metrics that are the focus of OAM-PM, delay and loss. The different metrics have their own unique storage structures and will allocate their own measurement intervals for these structures. This is regardless of whether the performance data is gathered with a single packet or multiple packet types.
Delay metrics include the following:
- Frame Delay (FD)- The amount of time it takes to travel form the source to the destination and back
- InterFrame Delay Variation (IFDV) -The difference in the delay metrics between two adjacent packets
- Frame Delay Range (FDR)-The difference between the minimum frame delay and the individual packet
- Mean Frame Delay (MFD) -The mathematical average for the frame delay over the entire window.
- FD, IFDV and FDR statistics are binnable results
- FD, IFDV, FDR and MFD all include a min/max/average
Unidirectional and round trip results are stored for each metric.
Unidirectional frame delay and frame delay range measurements require exceptional time of day clock synchronization. If the time of day clock does not exhibit extremely tight synchronization, unidirectional measurements will not be representative. In one direction, the measurement will be artificially increased by the difference in the clocks. In one direction, the measurement will be artificially decreased by the difference in the clocks. This level of clocking accuracy is not available with NTP. In order to achieve this level of time of day clock synchronization, consideration must be given to Precision Time Protocol (PTP) 1588v2.
Round trip metrics do not require clock synchronization between peers since the four timestamps allow for accurate representation of the round trip delay. The mathematical computation removes remote processing and any difference in time of day clocking. Round trip measurements do require stable local time of day clocks.
Any delay metric that is negative will be treated as zero and placed bin 0, the lowest bin which has a lower boundary of 0 microseconds. In order to isolate these outlying negative results, the lower boundary of bin 1 for the frame delay type could be set to a value of 1 micro second. This means bin 0 would then only collect results that are 1 micro second or less. This would be an indication of the number of negative results that are being collected.
Delay results are mapped to the measurement interval that is active when the result arrives back at the source.
Loss metrics are only unidirectional and will report Frame Loss Ratio (FLR) and availability information. Frame loss ratio is the percentage computation of loss (lost/sent). Loss measurements during periods of unavailability are not included in the FLR calculation as they are counted against the unavailability metric.
Availability requires relating three different functions. First, the individual probes are loss or received based on sequence numbers in the protocol. A number of probes are rolled up into a small measurement window (delta-t). Frame loss ratio is computed over all the probes in a small window. If the resulting percentage is higher than the configured threshold, the small window is marked as high loss. If the resulting percentage is lower than or equal to the threshold, the small window is marked as non-high loss. A sliding window is defined as some number of small windows. The sliding window is used to determine availability and unavailability events. Switching from one state to the other requires every small window in the sliding window to be the same state and different from the current state. The maximum size of the sliding window cannot be greater than 100 seconds. The default values for these availability parameters can differ from PDU type to PDU type.
Availability and unavailability counters are incremented based on the number of small windows that have occurred in all available and unavailable windows.
Availability and unavailability reporting is not meant to capture and report on service outages or communication failures. Communication failures of a bidirectional or unidirectional nature must be captured using some other means of connectivity verification, alarming, or continuity checking. During periods of complete or extended failure, it becomes necessary to timeout individual test probes. It is not possible to determine the direction of the loss because no response packets are being received back on the source. In this case, the statistics calculation engine will maintain the previous state updating the appropriate directional availability or unavailability counter. At the same time, an additional per direction undetermined counter will be updated. This undetermined counter is used to indicate that the availability or unavailability statistics were indeterminable for a number of small windows.
During connectivity outages the higher level systems could be used to discount the loss measurement interval which covers the same span as the outage.
Availability and unavailability computations may delay the completion of a measurement interval. The declaration of a state change or the delay to closing a measurement interval could be equal to the length of the sliding window and the timeout of the last packet. A measurement interval cannot be closed until the sliding window has determined availability or unavailability. If the availability state is changing and the determination is crossing two measurement intervals, the measurement interval will not complete until the declaration has occurred. Typically, standards bodies indicate the timeout value per packet. For Ethernet, the timeout value for DMMv1, LMM, and SLM is set at 5s and is not configurable.
There are no log events based on availability or unavailability state changes. Based on the subjective nature of these counters, considering complete failure or total loss when it may not be possible to determine availability or unavailability, these counters represent the raw values that must be interpreted.
During times of availability, there can be times of high loss intervals (HLI) or consecutive high loss intervals (CHLI). These are indicators that the service was available, but individual small windows or consecutive small windows experienced frame loss ratios exceeding the configured acceptable limit. A HLI is any single small window that exceeds the configured frame loss ratio. This could equate to a severely errored second, assuming the small windows is one second in length. A CHIL is consecutive high loss intervals that exceeds a consecutive threshold within the sliding window. Only one CHLI will be counted within a window. HLI and CHLI counters are only incremented during periods of availability. These counters are not incremented during periods of unavailability.
Both ETH-SLM and ETH-LMM provide methods for reporting loss. ETH-SLM uses the synthetic packets on the wire. ETH-LMM monitors the amount of service data. ETH-LMM frame loss counting is significantly different from ETH-SLM synthetic packet counting. The PDUs provide the largest variance.
The SLM PDU includes a sequence number that allows the mapping of message to the appropriate responses. The LMM PDU is fixed without support for optional TLVs. ETH-LMM has no method of correlating message and response. This means the LMR could represent a sample window equating to more than one LMM. SLM produces known and constant load on the network, whereas service data frames, counted by LMM, will vary or possibly be null. These two facts require slightly different approaches to availability and reliability.
LMM requires the availability command to not be shut down in order to enable the collection and computation of availability. When availability is not enabled, the existing behavior for frame loss ration min/max/avg remains unchanged. Determining if any new min/max has been encountered and computing the avg is based on every individual LMR. When LMM availability is enabled, the determination of the new min/max is based on the delta-t window. The longer sample size reduces the impact of gain and loss that may be introduced by reordering. No new FLR min/max values will be considered during periods of determined unavailability, regardless of the configuration for the availability option. The average FLR computation depends on the configuration of the availability metric. If availability is enabled, FLR is based on the sum of all LMR calculations received during periods of availability. If availability is not enabled, FLR is based on the LMR received prior to the closing of the measurement interval.
LMM will continue to count and report transmit and receive delta frames collected by the collect-lmm-stats command for the SAP, regardless of availability state. LMM will continue to display data frames counted during periods of unavailability; however, these frames will not count towards the average FLR of the measurement interval. In contrast, SLM does not count the synthetic packets on the wire during periods of unavailability. The raw transmit and receive information gathered by LMM has significant value regardless of availability in an unavailability state.
LMM includes a new counter, undetermined-delta-t, for the forward and backward directions. This new counter counts the number of delta-t windows that have no LMR responses recorded in that window of time, and provide an indication of the quality and scope of the delta-ts.
Figure 42 looks at loss in a single direction using synthetic packets. It demonstrates what happens when a possible unavailability event crosses a measurement interval boundary. As shown, the first 13 small windows are all marked available (1). This means that the lost probes that fit into each of those small windows did not equal or exceed a frame loss ratio of 50%. The next 11 small windows are marked as unavailable. This means that the lost probes that fit into each of those small windows were equal to or above a frame loss ratio of 50%. After the 10th consecutive small window of unavailability, the state transitions from available to unavailable. The 25th small window is the start of the new available state which is declared following the 10th consecutive available small window. Notice that the frame loss ratio (FLR) is 00.00%. This is because all the small windows that are marked as unavailable are counted towards unavailability and as such are excluded from impacting the flr. If there were any small windows of unavailability that were outside an unavailability event, they would be marked as HLI or CHLI and be counted as part of the frame loss ratio.
Figure 42: Evaluating and Computing Loss and Availability
Bin Groups
Bin groups are templates that are referenced by the session. Three types of binnable statistics are available:
- Frame Delay (FD); round trip, forward and backward
- InterFrame Delay Variation (IFDV); round trip, forward and backward
- Frame Delay Range (FDR); round trip, forward and backward
Each of these metrics can have up to 10 bins configured to group the results. Bins are configured by indicating a lower boundary. Bin 0 has a lower boundary that is always zero and not configurable. The micro second range of the bins is the difference between the adjacent lower boundaries. For example, bin-type fd bin 1 configured with a lower-bound 1000 micro seconds means bin 0 will capture all frame delay statistics results between 0 and 1ms. Bin 1 will capture all results above 1ms and below the bin 2 lower boundary. The last bin to be configured would represent the bin that collects all the results at and above that value. Not all ten bins must be configured.
A bin group configuration may relegate the first and last bin to capture anomalous measurements. Anomalous measurements can result from legacy equipment that queues a number of packets prior to circuit establishment. The relegation model characterizes these bins as non-representative of real network delay measurements. Results in these bins should be omitted from the average (avg) calculation. To accommodate these models, the command exclude-from-avg is available under the config>oam-pm>bin-group>bin-type hierarchy. This excludes results from the rolling average calculation that map to the excluded bins. The bins statistics will still accumulate all of the results, but the results are not part of the average computation. Every configured bin is included in the average calculation by default.
Each binnable delay metric type requires their own values for the bin groups. Each bin in a type is configurable for one value. It is not possible to configure a bin with different values for round trip, forward and backward. Consideration must be given to the configuration of the boundaries that represent the important statistics for that specific service or the values that meet the desired goals.
As stated earlier in this section, this is not a dynamic environment. If a bin group is being referenced by any active test the bin group cannot shutdown. In order to modify the bin group, it must be shutdown. If there is a requirement to change the setting of a bin group where a large number of sessions are referencing a bin group, migrating existing sessions to a new bin group with the new parameters could be considered to reduce the maintenance window.
Bin group 1 is the default bin group. Every session requires a bin group to be assigned. By default, bin group 1 is assigned to every OAM-PM session that does not have a bin group explicitly configured. Bin group 1 cannot be modified. Any bin lower-bound value that aligns with the 5000 μs (5 ms) default value (bin number × 5000 μs) will not be displayed as part of the output of the info command within the configuration. The info command does not display default values. The info detail command is required to show the default values. The bin group 1 configuration parameters are shown below.
Relating the Components
Figure 43 brings together all the concepts discussed in the OAM-PM architecture. It shows a more detailed hierarchy than previously shown in the introduction including the relationship between the tests, the measurement intervals, and the storage of the results.
Figure 43 is a logical representation and not meant to represent the exact flow between elements in the architecture. For example, the line connecting the "Acct-Policy" and the "Intervals Stored & Collected" is not intended to show the accounting policy being responsible for the movement of data from completed records "to Be Collected" to "Collected".
Figure 43: Relating OAM-PM Components
IP Performance Monitoring
The following configuration includes the configuration information specific to the TWAMP Light session controller. It does not include the MPLS configuration or the TWAMP Light session-responder configuration. For complete details on configuring the session-responder, refer to “TWAMP Light” in the IP Performance Monitoring (IP PM) section.
Accounting Policy Configuration
Service Configuration
OAM-PM Configuration
Ethernet Performance Monitoring
The following configuration provides an example comprised of the different Ethernet OAM PM elements using ETH-CFM tools.
Accounting Policy Configuration
ETH-CFM Configuration
Service Configuration
Ethernet OAM-PM Configuration
The RAW measurement interval can also use the monitor command to automatically update the statistics.
The following configuration and show commands provide an example of how frame loss measurement (ETH-LMM) can be used to collect frame loss metrics and the statistics gathered.
The LMM reflector must be configured to collect the statistics on the SAP or MPLS SDP binding where the terminating MEP has been configured.
The launch point must also enable statistical collection on the SAP or MPLS SDP binding of the MEP launch point.
The launch point must configure the OAM-PM session parameters. The CLI below shows a session configured with DMM for delay measurements (1s intervals) and LMM for frame loss measurements (10s interval). When using LMM for frame loss, the frame loss ratio and the raw frame transmit and receive statistics are captured, along with basic measurement interval and protocol information.
OAM-PM Event Monitoring
The previous section described the OAM-PM architecture. That provides a very powerful and well defined mechanism to collect key performance information. This data is typically uploaded to higher level systems for consolidation and reporting tracking performance trends and conformance to Service Level Agreements (SLA). Event monitoring (event-mon) allows thresholds to be applied to the well defined counters, percentage and binned results for a single and measurement interval per session. This Traffic Crossing Alert (TCA) function can be used to raise a log event when a configured threshold is reached. Optionally, The TCA can be cleared if a clear threshold is not breached in a subsequent measurement interval.
Thresholds can be applied to binned delay metrics and the various loss metric counters or percentages. The type of the TCA is based on the configuration of the two threshold values, threshold raise-threshold and clear clear-threshold. The on network element TCA functions are provided to log an event that is considered an exception condition that requires immediate attention. A single threshold can be applied to the collected metric.
Stateless TCAs are those events that do not include a configured clear-threshold. Stateless TCAs will raise the event when the raise-threshold is reached but do not share state with any following measurement intervals. Each subsequent measurement interval is treated as a unique entity without previous knowledge of any alerts raised. Each measurement interval will consider only its data collection and raise all TCAs as the thresholds are reached. A stateless event raised in one measurement interval silently expires at the end of that measurement interval without an explicit clear event.
Stateful TCAs require the configuration of the optional clear clear-threshold. Stateful TCAs will raise the event when the raise-threshold is reached and carry that state forward to subsequent measurement intervals. That state is maintained and no further raise events will be generated for that monitored event until a subsequent measurement interval completes and the value specified by the clear-threshold is not reached. When a subsequent measurement interval completes and the specific clear-threshold is not crossed an explicit clear log event is generated. Clear events support a value of zero which means that the event being cleared must have no errors at the completion of the measurement interval to clear a previous raise event. At this point, the event is considered cleared and a raise is possible when the next threshold raise-threshold is reached.
The raise threshold must be higher than the clear threshold. The only time both can be equal is if they are disabled.
Alerts can only be raised and cleared once per measurement interval per threshold. Once a raise is issued no further monitoring for that event occurs in that measurement interval. A clear is only logged at the end of a subsequent measurement interval following a raise and only for stateful event monitoring.
Changing threshold values or events to monitor for the measurement interval do not require the individual tests within the session or the related resource (bin-group) to be shutdown. Starting the monitoring process, adding a new event to monitor, or altering a threshold will stop the existing function that has changed with the new parameters activated at the start of the next measurement interval. Stopping the monitoring or removing an event will maintain the current state until the completion of the adjacent measurement interval after which any existing state will be cleared.
OAM-PM sessions may have multiple measurement intervals. Event monitoring can only be configured against a single configured measurement interval per session.
Delay event thresholds can be applied to Frame Delay (FD), InterFame Delay Variation (IFDV) and Frame Delay Range (FDR). These are binned delay metrics with directionality, forward, backward and round-trip. Configuration of event thresholds for these metrics are within the config>oam-pm>bin-group bin-group-number and applied to a specific bin-type. The delay-event specifies the direction that is to be measured {forward | backward | round-trip}, the thresholds and the lowest bin number. The lowest bin value applies the threshold to the cumulative results in that bin and all higher. The default bin group (bin-group 1) cannot be modified and as such does not support the configuration of event thresholds. A session that makes use of a bin group inherits those bin group attributes including delay event threshold settings.
If the operator subscribes to a model that relegates one or more of the highest bins to anomalous results, these results should not be included in the TCA count. The delay-event-exclusion command is available under the config>oam-pm>bin-group>bin-type hierarchy. This command will exclude any results in the specified bin, along with the results in any bin higher than the one specified, from the TCA count. In order to use this command, a delay-event in the same direction for the same bin type must be configured. The excluded bins must be higher than the TCA threshold configured using the threshold raise-threshold command. This command is similar to the delay-event command. This does not require the bin group to be shut down. On-the-fly changes will cause the delay event to be suspended until the next measurement interval for the affected bin type.
Ethernet supports gathering delay information using the ETH-DMM protocol. IP supports the gathering of delay information using the TWAMP Light function.
Loss events and threshold are configured within the session under the specific loss based protocol. Loss event thresholds can be applied to the average Frame Loss Ratio (FLR) in the forward and backward direction. This event is analyzed at the end of the measurement interval to see if the computed FLR is equal to or higher than the configured threshold as a percentage. The availability and reliability loss events may be configured against the counts in forward and backward direction as well as the aggregate (sum of both directions). The aggregate is only computed for thresholds and not stored as an independent value in the standard OAM-PM loss dataset. The availability and reliability loss events include the high loss interval (HLI), Consecutive HLI (CHLI), unavailability, undetermined availability and undetermined unavailability.
Ethernet supports the gathering of loss information using ETH-SLM and ETH-LMM. IP supports the gathering of loss information using TWAMP Light functionality. ETH-SLM, ETH-LMM, and TWAMP Light support threshold configuration for FLR and the availability and reliability loss events.
Configuring the event threshold and their behavior, stateless or stateful, completes the first part of the requirement. The event monitoring function must be enabled per major function, delay or loss. This is configured under the measurement interval that is used to track events. One measurement interval per session can be configured to track events. If event tracking of type, delay or loss, is configured against a measurement interval within the session no other measurement interval can be used to track events. For example, if the measurement interval 15-min for oam-pm session eth-pm-sesison1 has delay-events active, no other measurement interval within that session can be used to track delay or loss-events.
When a raise threshold is reached a log event warning is generated from the OAM application using the number 2300. If the event is stateful, clear clear-threshold configured, an explicit clear will be logged when a subsequent measurement interval does not exceed the clear threshold. The clear event is also a warning message from the OAM protocol but uses number 2301.
The session name is included as part of the subject.
A more detailed message is included immediately following the subject. This includes:
- type of the event — raised or cleared
- session name in quotations
- test type — representing the protocol (dmm, slm, lmm, or twl)
- the start time of the measurement interval in UTC format
- delay bin type — fd, fdr, ifdv. Not applicable for loss measurement.
- threshold type — the metric type that is covered by this alarm. Delay will include the various delay metrics, and loss will include the various loss metrics.
- direction — forward, backward, round-trip or aggregate
- bin lower bound (us) — the lower bound value of the lowest bin associated with the TCA. Not applicable for loss measurement.
- configured threshold — the value of the threshold
- operational value — the measured value relating to the action
- tca type — stateful or stateless
- suspect flag — copied from the measurement interval (events do not affect the suspect flag)
Only those events deemed important should be configured and activated per session.
A simple Ethernet session example is provided to show the basic configuration and monitoring of threshold event monitoring.
The bin group is configured for the required thresholds.
The OAM-PM session contains all the session attributes, test attributes and the loss event thresholds and the configuration of the event monitoring functions.
Traceroute with ICMP Tunneling In Common Applications
This section provides sample output of the traceroute OAM tool when the ICMP tunneling feature is enabled in a few common applications.
The ICMP tunneling feature is described in Tunneling of ICMP Reply Packets over MPLS LSP and provides supports for appending to the ICMP reply of type Time Exceeded the MPLS label stack object defined in RFC 4950. The new MPLS Label Stack object permits an LSR to include label stack information including label value, EXP, and TTL field values, from the encapsulation header of the packet that expired at the LSR node.
This section describes the following topics: