2. sFlow
2.1. sFlow Overview
sFlow is used to monitor data traffic flows traversing different points in a network. The sFlow functionality uses an sFlow agent and an sFlow collector. The agent is software that runs on a network element and samples and reports flow headers and statistics. The collector is software that typically runs on a remote server and receives the flow headers and statistics from one or more sFlow agents.
Sampling and reporting is accomplished as the sFlow agent running on a network element takes periodic samples of ingress traffic and reports the data to one or more collectors. The network element does not need to maintain a local flow cache. Instead, the sampled header information is immediately sent to the collector without additional processing.
The SR Linux supports sFlow version 5 behavior and formats. On 7250 IXR chassis-based systems, sFlow is implemented in hardware. On 7220 IXR-D2, D3 and IXR-H systems, sFlow functionality is implemented in software. sFlow behavior is identical on both platforms.
2.1.1. sFlow sampling
sFlow works by sampling flow data and reporting the samples to the configured sFlow collectors. Based on the configured system sampling rate, the forwarding plane samples ingress packet flows and sends the sampled headers to the sFlow agent in the control plane.
All ingress packets are subject to sampling. Each sample includes the top 256 bytes of the sampled packet, starting at the outer Ethernet header. The sampled packets are sent to the configured sFlow collectors with the sampled data in sFlow raw packet data format.
For sampled IPv4 packets, the IPv4 header data fields are sent with the raw data. For sampled IPv6 packets, the IPv6 header data fields are sent with the raw data.
2.1.2. sFlow collector reporting
sFlow reports sampled headers and statistics to the configured collectors using IP/UDP datagrams. UDP port 6343 is the default destination port, but you can optionally configure a different port. Sampled packets are sent as soon as the samples are taken, and interface statistics are sent based on the configured poll-interval (default 20 seconds). SR Linux supports up to 8 remote sFlow collectors. Each collector can only have one IPv4 address. The flow and counter samples are aggregated in a sflow datagram packet in software implementation.
2.1.3. sFlow counter samples
Another aspect of the sFlow agent is streaming of interface statistics to configured sFlow collectors. Statistics are only sent to a collector if sFlow has been enabled on an interface. Interface statistics are sent based on a default poll-interval of 20 seconds with a separate timer for each interface. When the interval expires. the current value of each associated statistics are sent to the configured collectors.
The interface counter sample contains:
- Interface index
- Interface type
- Interface speed
- Oper and admin status
- Input octets
- Input packets
- Input broadcast packets
- Input discards packets
- Output errors
- Output octets
- Output packets
- Output broadcast packets
- Output discards packets
2.2. Configuring sFlow
2.2.1. Configuring the sFlow agent
To configure the sFlow agent on the system, you enable sFlow, and optionally configure the sampling rate (by default, 1 out of every 10,000 packets) and sample size (by default, 256 bytes are sampled from each packet).
Example:
The following example enables sFlow on the system and configures the system sampling rate and sample size. Note that the sample size and polling interval are not configurable. The following default sample size applies:
- 7220 IXR-D2, D3 and 7220 IXR-H systems: 256 bytes
- 7250 IXR 6/10: 220 bytes
2.2.2. Configuring sFlow collectors
The sFlow agent sends sampled packets to sFlow collectors. You can configure up to 8 sFlow collectors to receive the data. To configure an sFlow collector, you specify its IP address, associated network instance, and IP address to be used as the source IP address in sFlow packets sent from the SR Linux to the collector. You can optionally specify a destination port (by default, this is UDP port 6343).
| Note: Configuring a network-instance is mandatory. Also, a collector cannot be reached using the mgmt network-instance. |
Example:
The following example configures two sFlow collectors. The IP address for each collector is configured, as well as its network instance and source IP address. Each collector receives all samples.
2.2.3. Configuring sFlow for an interface
When sFlow is configured for an interface, the ingress packets are taken for sampling according to the sample-rate.
Example:
The following example enables sFlow on an interface.
2.3. Displaying sFlow information
2.3.1. Displaying the state of the sFlow agent
To display the system-wide state of the sFlow agent, including any sFlow parameters, collector configuration, and general statistics, use the info from state command in candidate or running mode, or the info command in state mode.
Example:
2.3.2. Displaying the status of the sFlow agent
Use the show system sflow status command in show mode to display the general status of the sFlow agent:
Example:
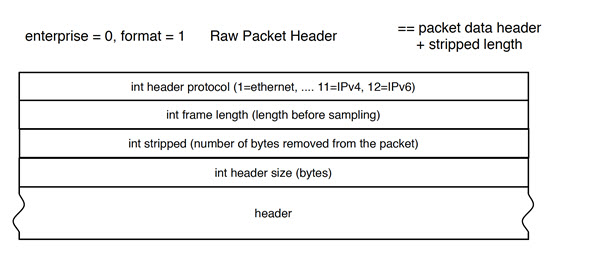
2.4. sFlow formats
Figure 1 shows an example of a raw packet header for an sFlow format.
Figure 1: Raw packet header
2.5. Sampled data and counter examples
The following is an example of sampled data:
The following is a counter sample example: