In active-active ISA redundancy, each ISA is subdivided into multiple logical ISAs. These logical sub-entities are referred to as members. NAT configuration of each member is saved in the CPM. In case that any one ISA fails, its members are downloaded by the CPM to the remaining active ISAs. Memory resources on each ISA are reserved to accommodate additional traffic from the failed ISAs. The amount of resources reserved per ISA depends on the number of ISAs in the system and the number of simultaneously supported ISA failures. The number of simultaneous ISA failures per system is configurable. Memory reservation affects NAT scale per ISA.
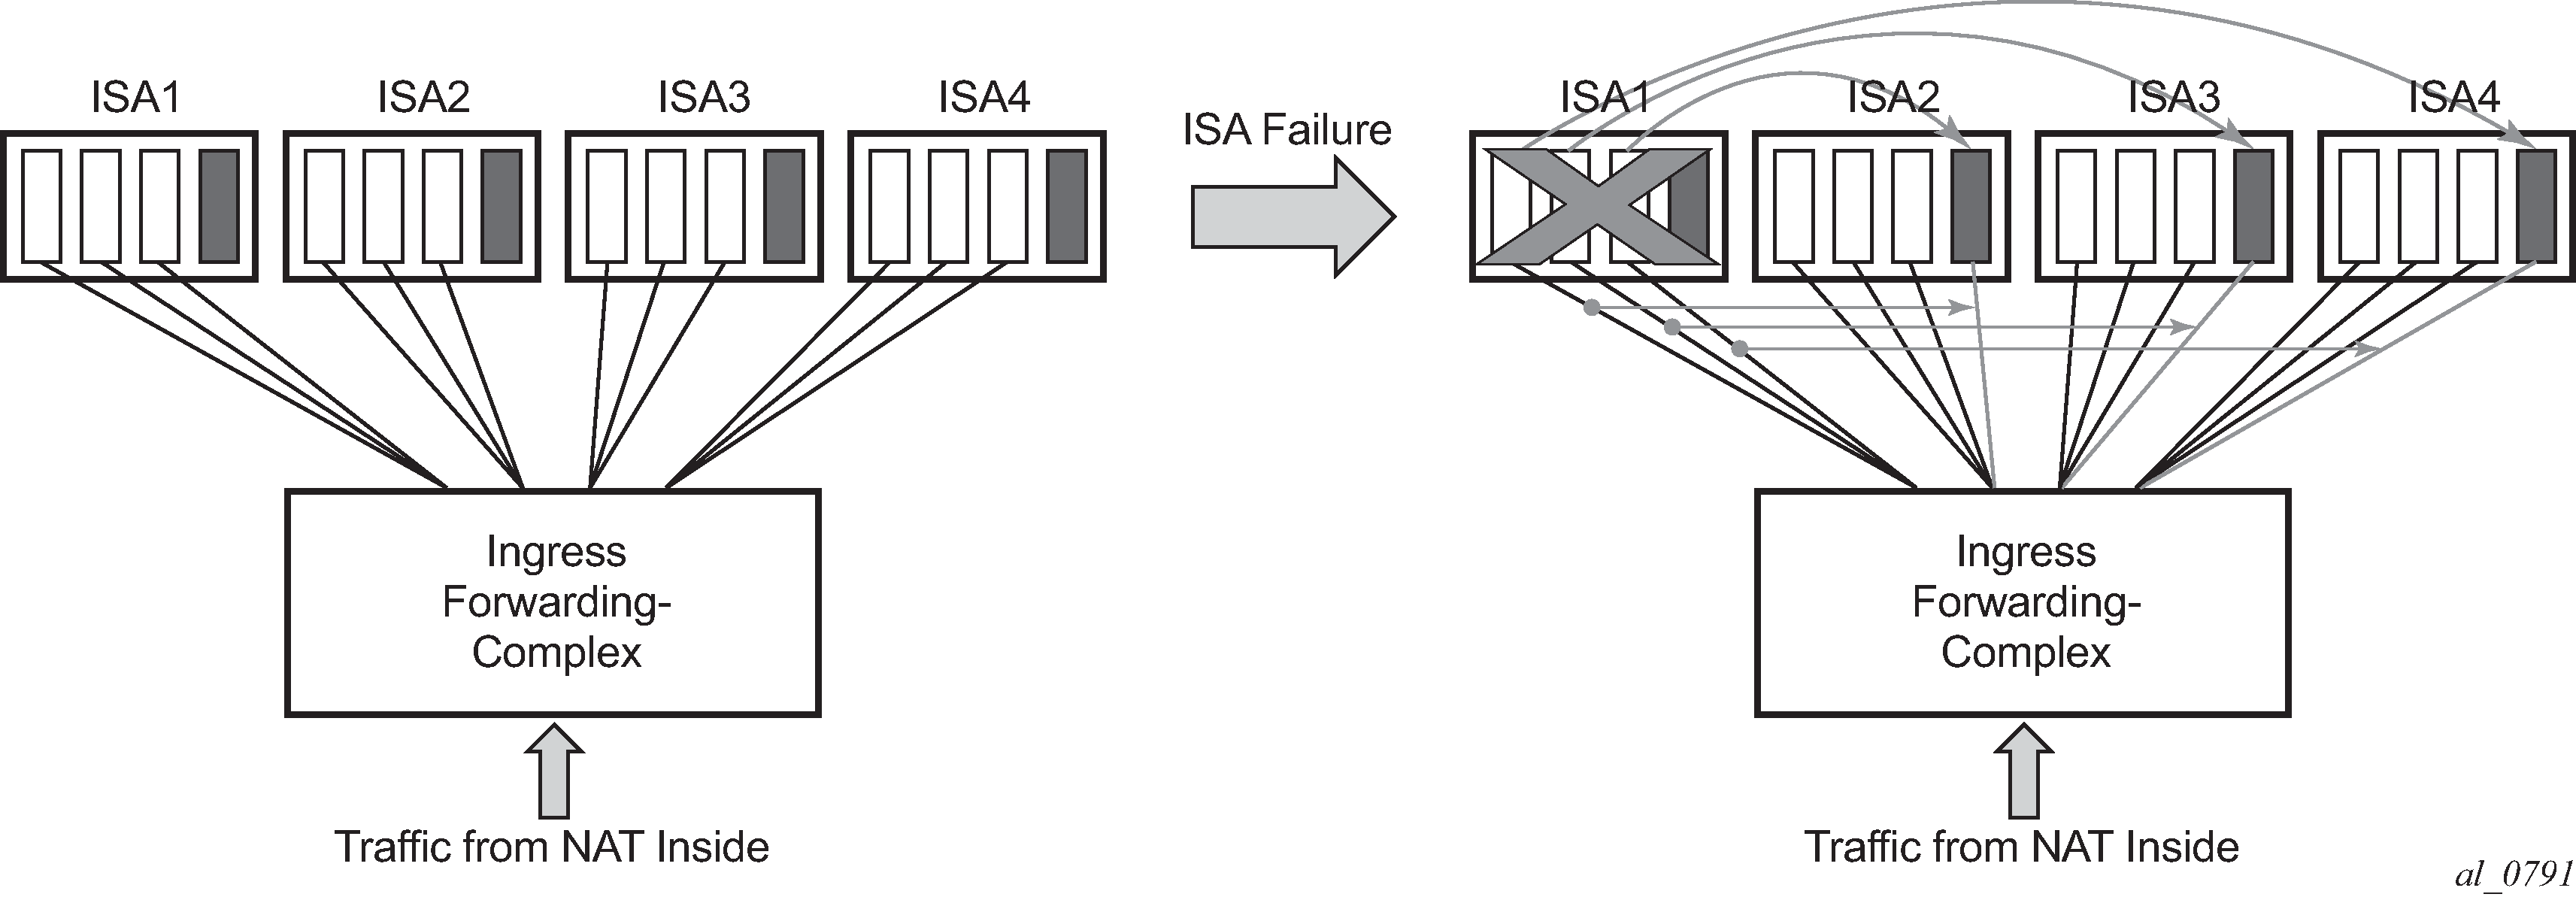
Traffic received on the inside is forwarded by the ingress forwarding complex to a predetermined member ISAs for further NAT processing. Each ingress forwarding complex maintains an internal link per member. The number of these internal links, along with other factors, determine the maximum number of members per system and with this, the granularity of traffic distribution over remaining ISAs in case of an ISA failure. The segmentation of ISAs into members for a single failure scenario is shown in Figure: Load distribution in active-active intra-chassis redundancy model. The protection mechanism in this example is designed to cover for one physical ISA failure. Each ISA is divided into four members. Three of those carry traffic during normal operation, while the fourth one has resources reserved to accommodate traffic from one of the members in case of failure. When an ISA failure occurs, three members are delegated to the remaining ISAs. Each member from the failed ISA is mapped to a corresponding reserved member on the remaining ISAs.
Active-active ISA redundancy model supports multiple failures simultaneously. The protection mechanism shown in Figure: Multiple failures is designed to protect against two simultaneous ISA failures. As the previous case, each ISA is divided into six members, three of which are carrying traffic under normal circumstances while the remaining three members have reserved memory resources.
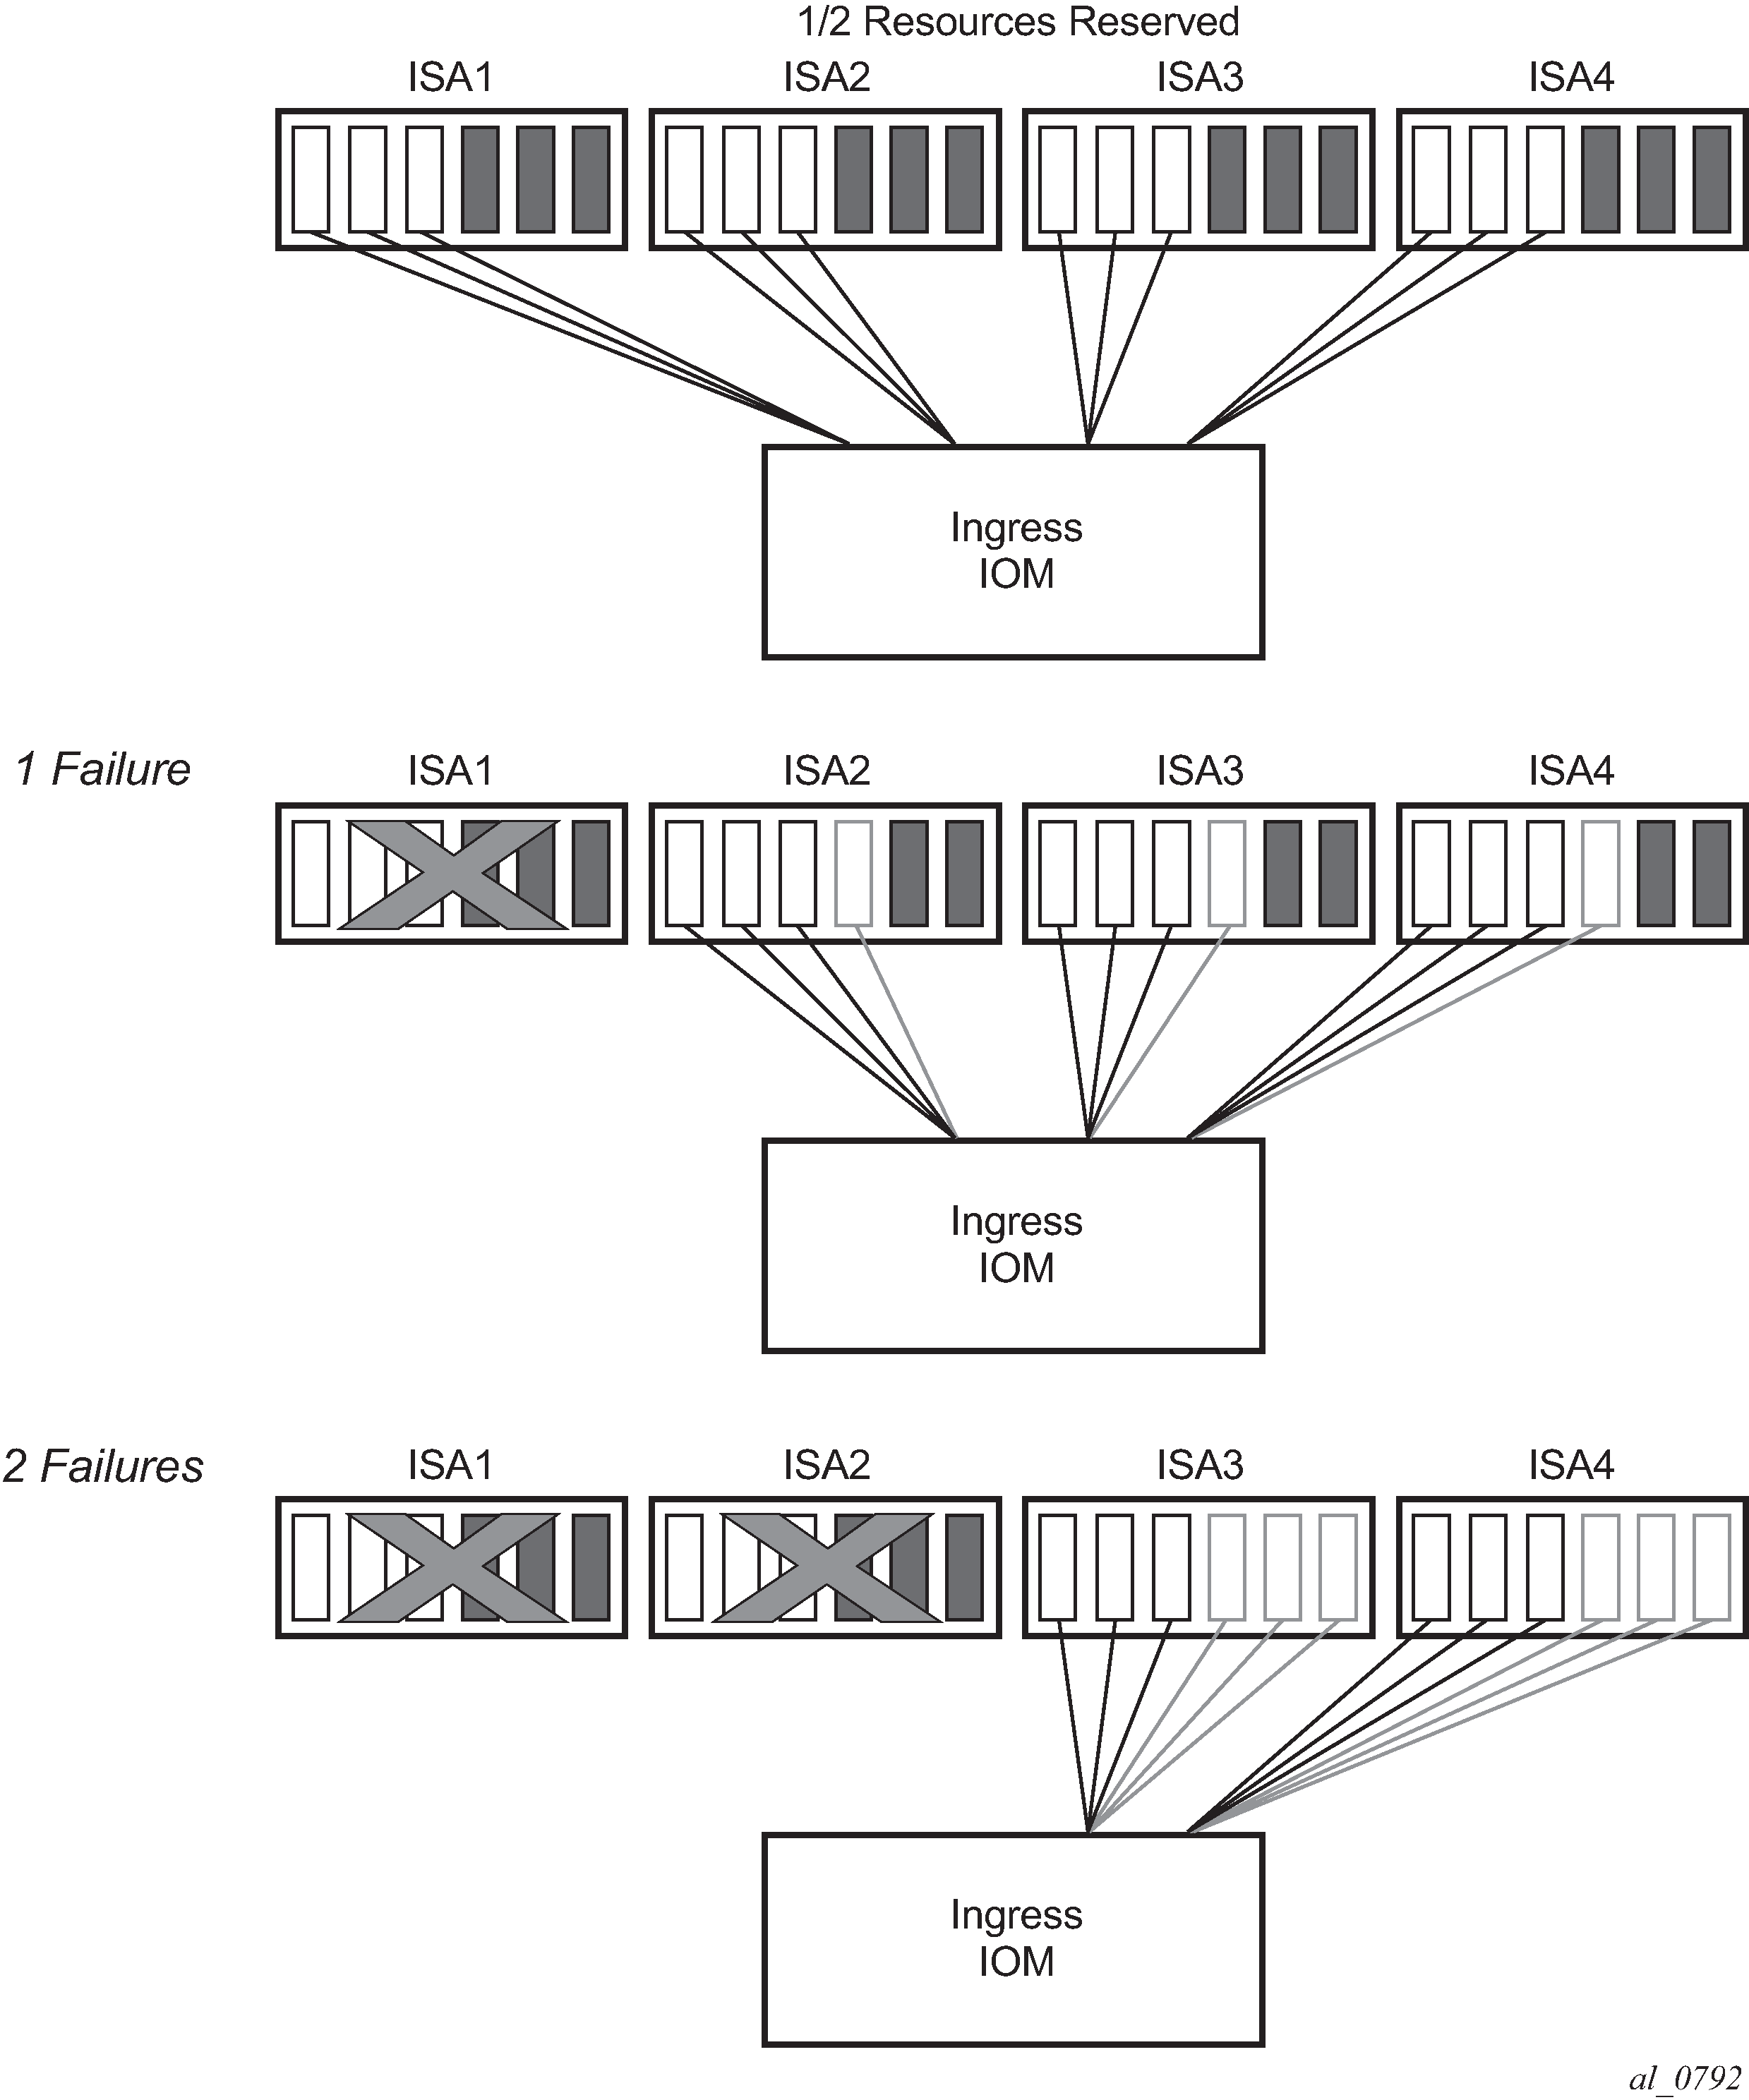
Table: Load distribution in active-active ISA redundancy model supporting single ISA failure shows resource utilization for a single ISA failure in relation to the total number of ISAs in the system. The resource utilization affects only scale of each ISA. However, bandwidth per ISA is not reserved and each ISA can operate at full speed at any time (with or without failures).
| Number of physical ISAs per system | Number of member ISAs per physical ISA (active/reserved) | Resource utilization per system in non-failed condition | Resource utilization per system with one failed ISA |
|---|---|---|---|
2 |
1A 1R |
50% |
100% |
3 |
2A 1R |
67% |
100% |
4 |
3A 1R |
75% |
100% |
5 |
3A 1R |
75% |
95% |
6 |
2A 1R |
66% |
83% |
7 |
2A 1R |
66% |
80% |
8 |
2A 1R |
66% |
79% |
9 |
1A 1R |
50% |
61% |
10 |
1A 1R |
50% |
60% |
11 |
1A 1R |
50% |
59% |
12 |
1A 1R |
50% |
58% |
13 |
1A 1R |
50% |
58% |
14 |
1A 1R |
50% |
57% |