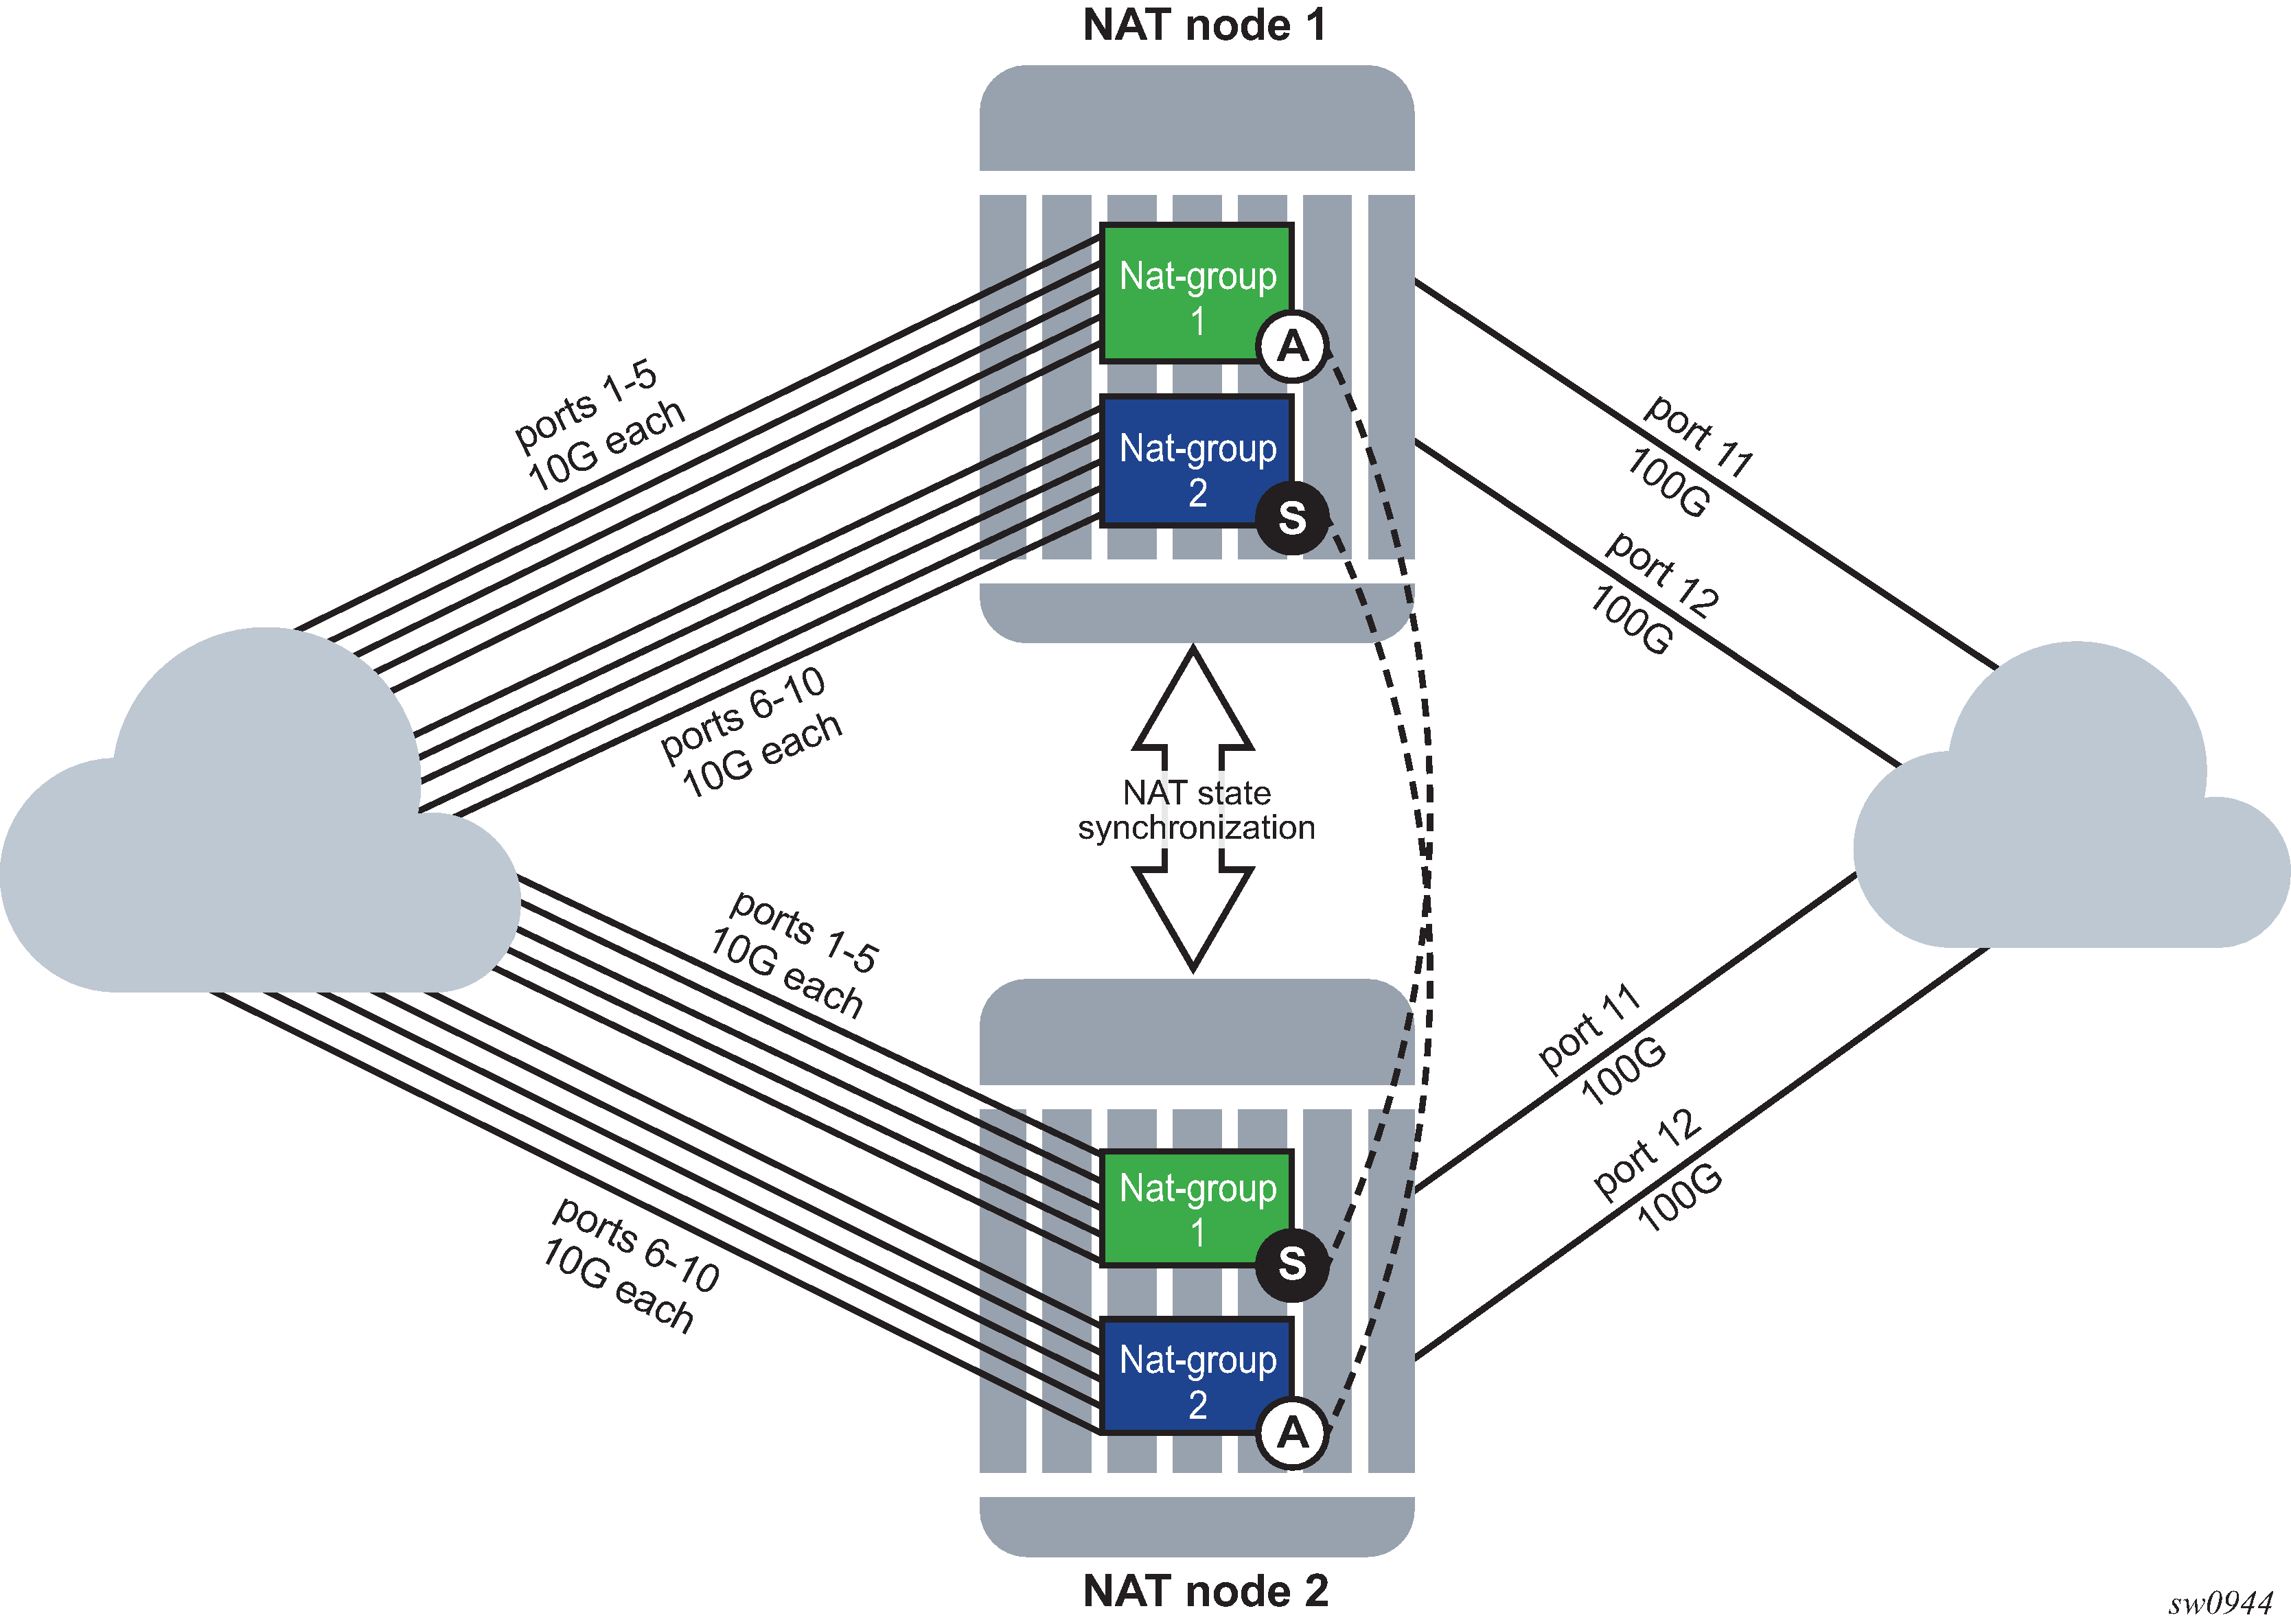
This example relies on the following assumptions in Figure: Port monitoring scenario:
Load sharing over redundant chassis is achieved through two nat-groups that are, under normal conditions (no failures), active on respective chassis:
nat-group 1 is active on NAT node 1.
nat-group 2 is active on NAT node 2.
Two 100G links on the network/public/outside side are shared between the two NAT groups on each node (Internet access). These links are redundant, and failure of one link does not have a negative effect on the traffic.
Each NAT group has five 10G ports connected on the subscriber/private/inside side. Planned traffic load over those links is between 30G and 40G, which means that one link can be safely lost, without affecting traffic in the NAT group.
The operator’s rules for managing failures are the following:
The scheme protects against two access link failures per NAT group and one network link failure, simultaneously.
The scheme protects against three access link failures per NAT group, simultaneously. However, in this case, there cannot be any network link failures.
In the two above scenarios, if both network links fail on the same node (while on the other node at least one is available), the node with two failed links becomes standby.
According to those rules, the following configuration can be applied:
configure
   isa
      nat-group 1
         active-mda-limit 5
         inter-chassis-redundancy
            monitor-port port-1 health-drop 6
            monitor-port port-2 health-drop 6
            monitor-port port-3 health-drop 6
            monitor-port port-4 health-drop 6
            monitor-port port-5 health-drop 6
            monitor-port port-11 health-drop 10
            monitor-port port-12 health-drop 10

The results for a randomly selected number of failure combinations (out of 360 valid combinations) is shown in Table: Randomly selected number of failure combinations .
‟N” indicates that the priority is equal, and unless preemption is enabled, the node that becomes active first, remains active.
| Node | Number of failures in nat-group 1 (10G ports) |
Number of failures in nat-group 2 (10G ports) |
Number of failures on shared network side (100G ports) |
Health of nat-group 1 | Health of nat-group 2 | State of nat-group 1 (active/standby) | State of nat-group 2 (active/standby) |
|---|---|---|---|---|---|---|---|
1 2 |
0 1 |
0 0 |
0 1 |
1000 984 |
1000 990 |
A S |
A S |
1 2 |
0 2 |
0 1 |
1 1 |
990 978 |
990 984 |
A S |
A S |
1 2 |
0 0 |
1 0 |
0 0 |
1000 1000 |
994 1000 |
N N |
S A |
1 2 |
1 2 |
1 0 |
0 0 |
1000 988 |
994 1000 |
A S |
S A |
1 2 |
1 0 |
0 2 |
1 1 |
984 990 |
990 978 |
S A |
A S |
1 2 |
1 2 |
1 1 |
1 1 |
984 978 |
984 984 |
A S |
N N |
1 2 |
1 1 |
2 0 |
0 0 |
994 994 |
988 1000 |
N N |
S A |
1 2 |
1 0 |
2 1 |
1 1 |
984 990 |
978 984 |
S A |
S A |
1 2 |
1 2 |
2 0 |
1 1 |
984 978 |
978 990 |
A S |
S A |
1 2 |
2 0 |
2 2 |
0 1 |
988 990 |
988 978 |
S A |
A S |